Did you see the Globe and Mail editorial last Sunday (June 28)? The Globe has plans to fix everything that’s wrong with the Canada-Wide Early Learning and Child Care program. A good objective, but I do wish the Globe would do some serious research before trotting out the same tired old solutions that have never worked for child care.
Their plan would return us to market-driven child care solutions with no controls on rising fees, no financial accountability for the expenditure of public dollars, and no preference for non-profit child care. There would be financial assistance for low-income families but not for others. Child care is apparently not a women’s issue and a children’s issue, it’s only a poverty issue. We’ve been there before. It didn’t work and we don’t want to go back.
The Globe and Mail wants free market child care with the add-on of a new voucher or tax credit system – to be run by Canada Revenue. The plan is to provide nearly free child care for low-income Canadians but little or no financial assistance to families that earn higher incomes.
Has the Globe and Mail investigated either of the Canadian examples of a tax credit used to fund child care? If it had, it would find the results have not been impressive.
Ontario’s CARE tax credit was implemented in 2019. Families earning above $150,000 were not eligible. Despite this, the Financial Accountability Office of Ontario reported that “Approximately two-thirds of the total CARE tax credit benefit will be distributed to families with incomes over the 50th income percentile…. Only three per cent of the total CARE tax credit benefit will be distributed to families with incomes below the 25th income percentile.” And the average benefit that a family receives is only $1,300 per year. So this tax credit is not very generous and apparently not a good way of helping low-income families that the Globe and Mail says it wants to prioritize.
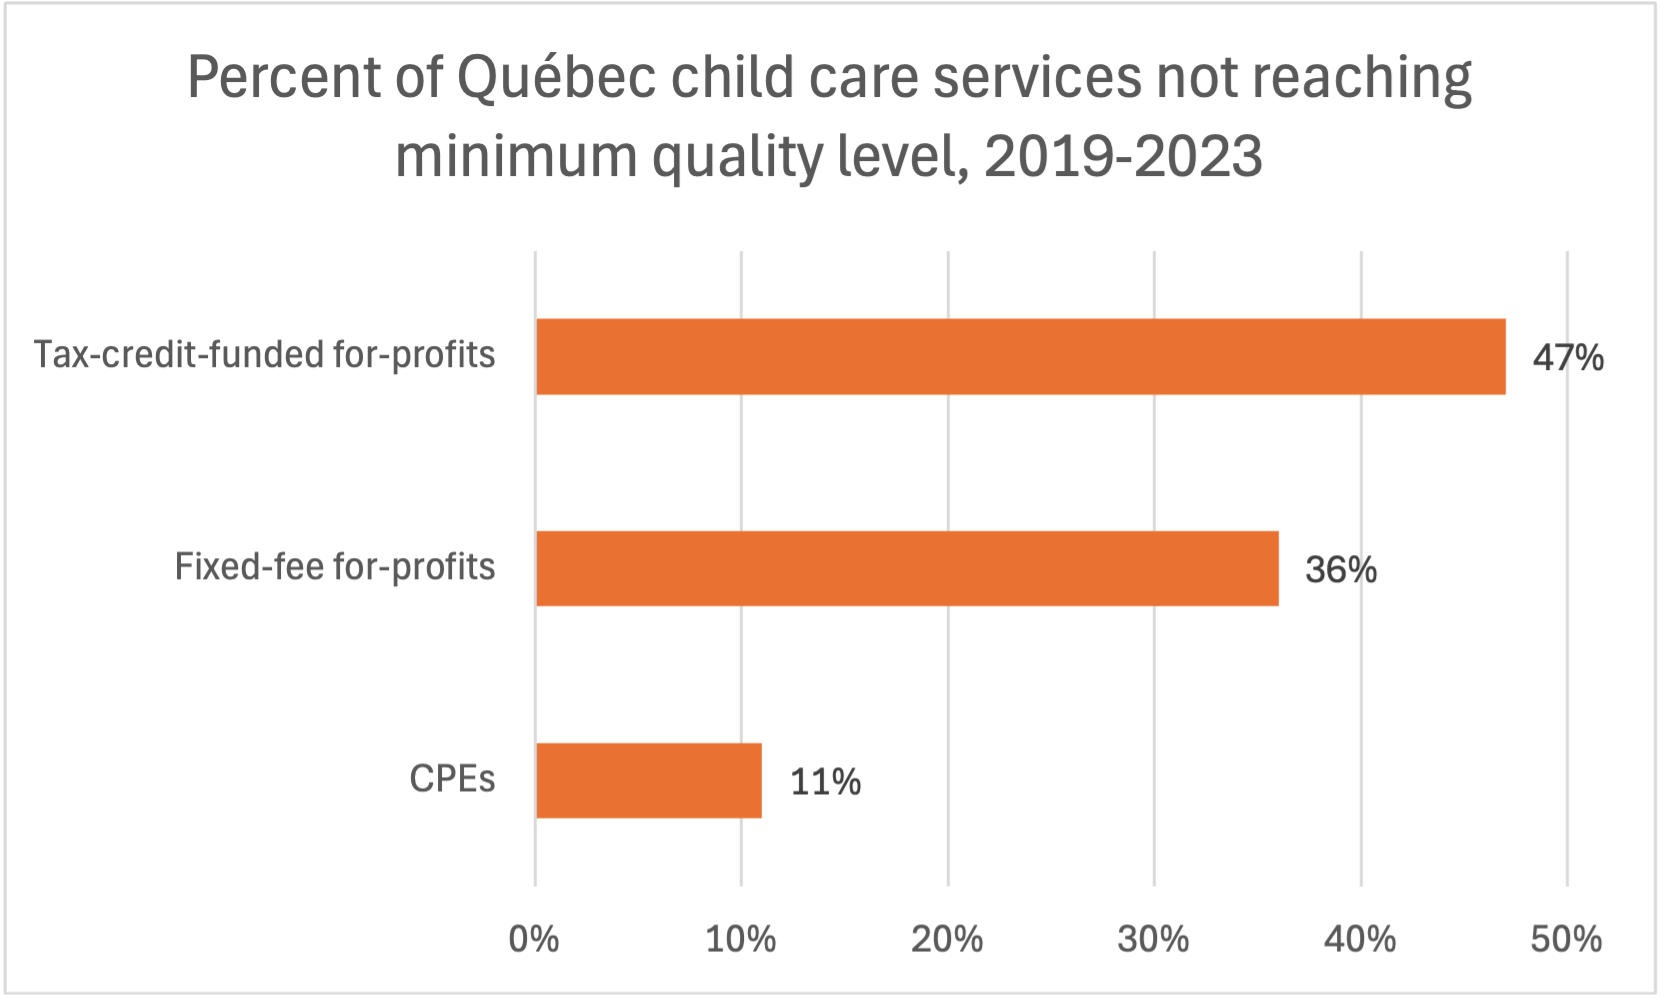
The other example of a tax credit to fund child care is in Quebec. From about 2009, this tax credit was used to encourage for-profits to enter the sector and provide more capacity. These providers could set their own fees and did not have the financial reporting requirements faced by other centres. Money poured into this part of the sector; it provided an increase in spaces but these spaces are publicly acknowledged to be of shocking average quality. Quebec’s Auditor General reported that nearly half (47%) of these tax credit funded child care centres did not even reach the minimum quality level. As shown in the charts below, staffing is much worse in these for-profit child care centres – apparently not their priority – and low quality follows as night follows day. Now that there is sufficient child care capacity in Quebec, large numbers of families are leaving these tax-credit-funded child care centres.

The Globe and Mail gets so many other things wrong, they are hard to count. They want to get rid of universal Canada-Wide child care because according to them:
- there are staff shortages that are not improving,
- the compensation of educators is not rising,
- the Canada-Wide child care program is failing to have any perceptible effect on mothers ability to access employment
- one-third of all Canadians with preschool children are on waiting lists and unable to access child care
- there is a narrow focus on non-profit child care, with punishing restrictions required by Ottawa on subsidies to for-profit child-care centres
On every one of these indicators, the Globe is wrong or misleading.
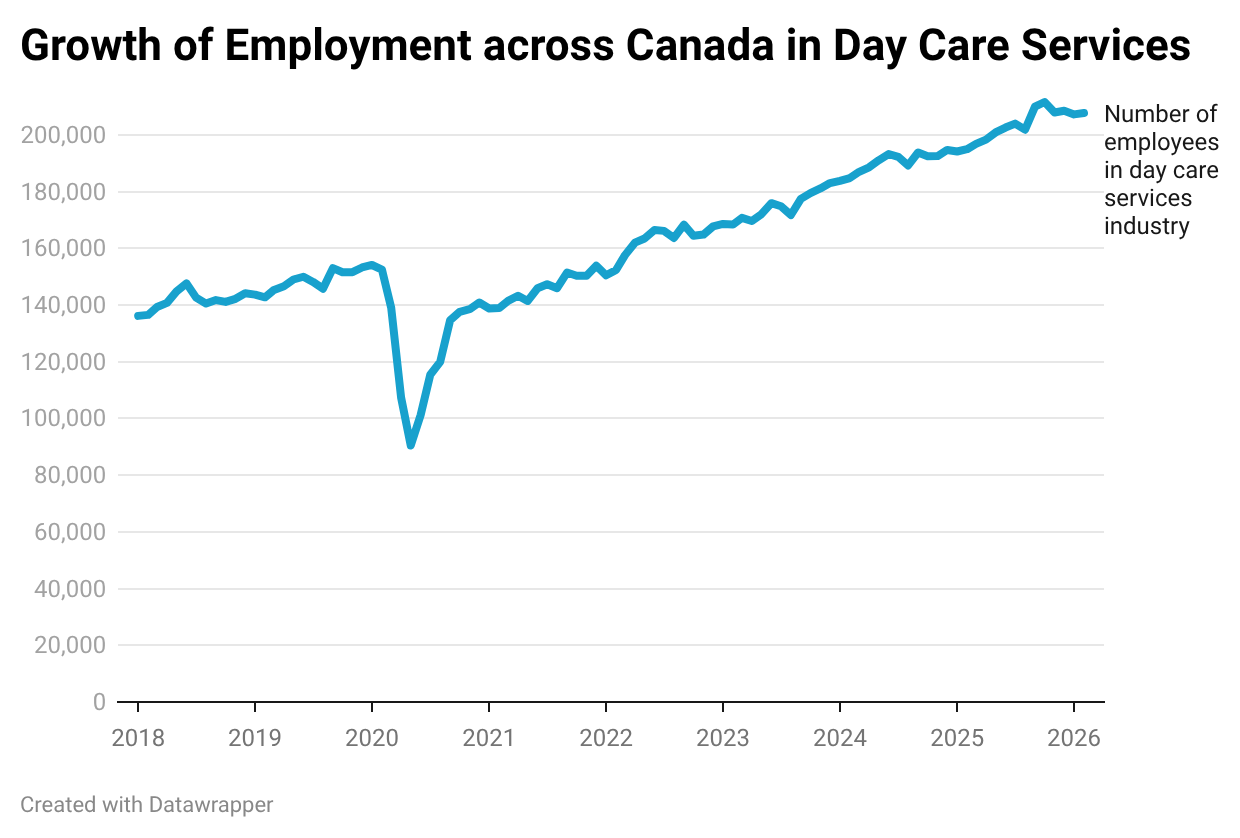
After reading the Globe editorial, you would probably be surprised to learn that the number of employees in the day care industry in Canada outside Quebec rose by 44.1% between January 2019 and January 2026 (Statistics Canada Table 14100220). Over that same period, across all industries the growth in employment was 8.5%.
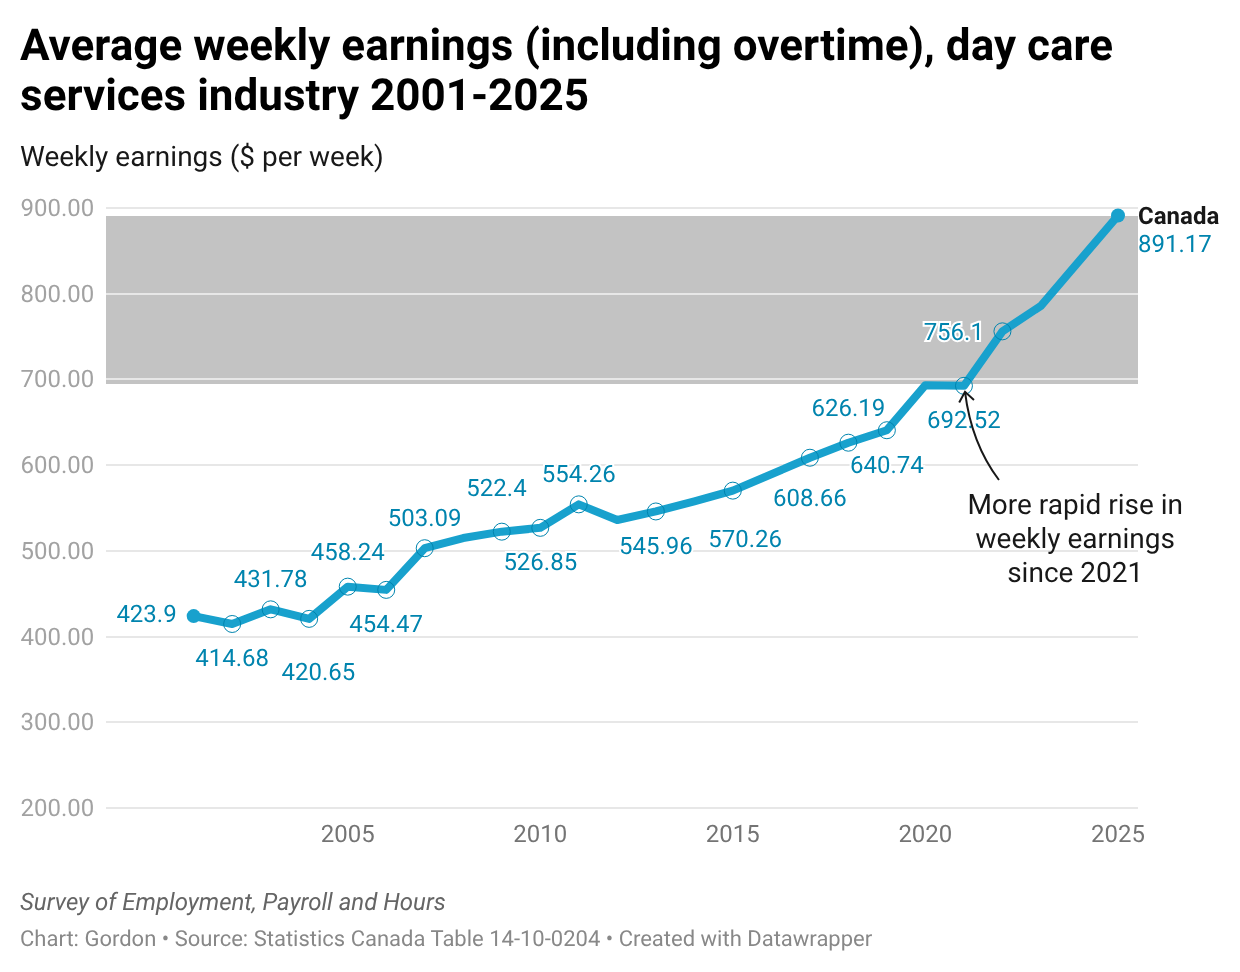
You might also be surprised to hear that average weekly earnings in the day care industry rose by 43.5% from April 2019 to April 2025. Over the same period, average weekly earnings across all industries rose by 27.4%. Compensation for child care educators is still low relative to other industries – average weekly earnings across all industries was $1,302.86 in 2025 – but it is improving.
Again, you might be surprised to hear that, contrary to what the Globe and Mail would have you believe, there is good evidence of rising labour force participation of mothers most affected by the child care reforms. Labour force participation rose by 3.7 percentage points from 2019 to 2025 for mothers with a youngest child 0-5, meaning about 65,000 mothers joined the labour force. For an appropriate comparison, look at mothers with children not affected by the Canada-Wide program. Mothers with a youngest child 6-12 increased their labour force participation over this same period by only 0.7 percentage points. And mums with a youngest child 13-17 increased labour force participation by only 1 percentage point.
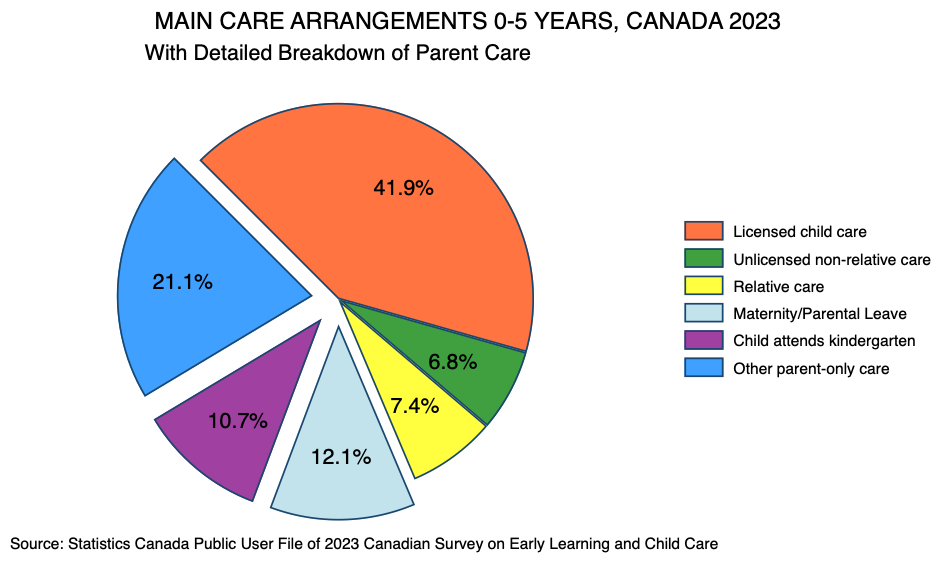
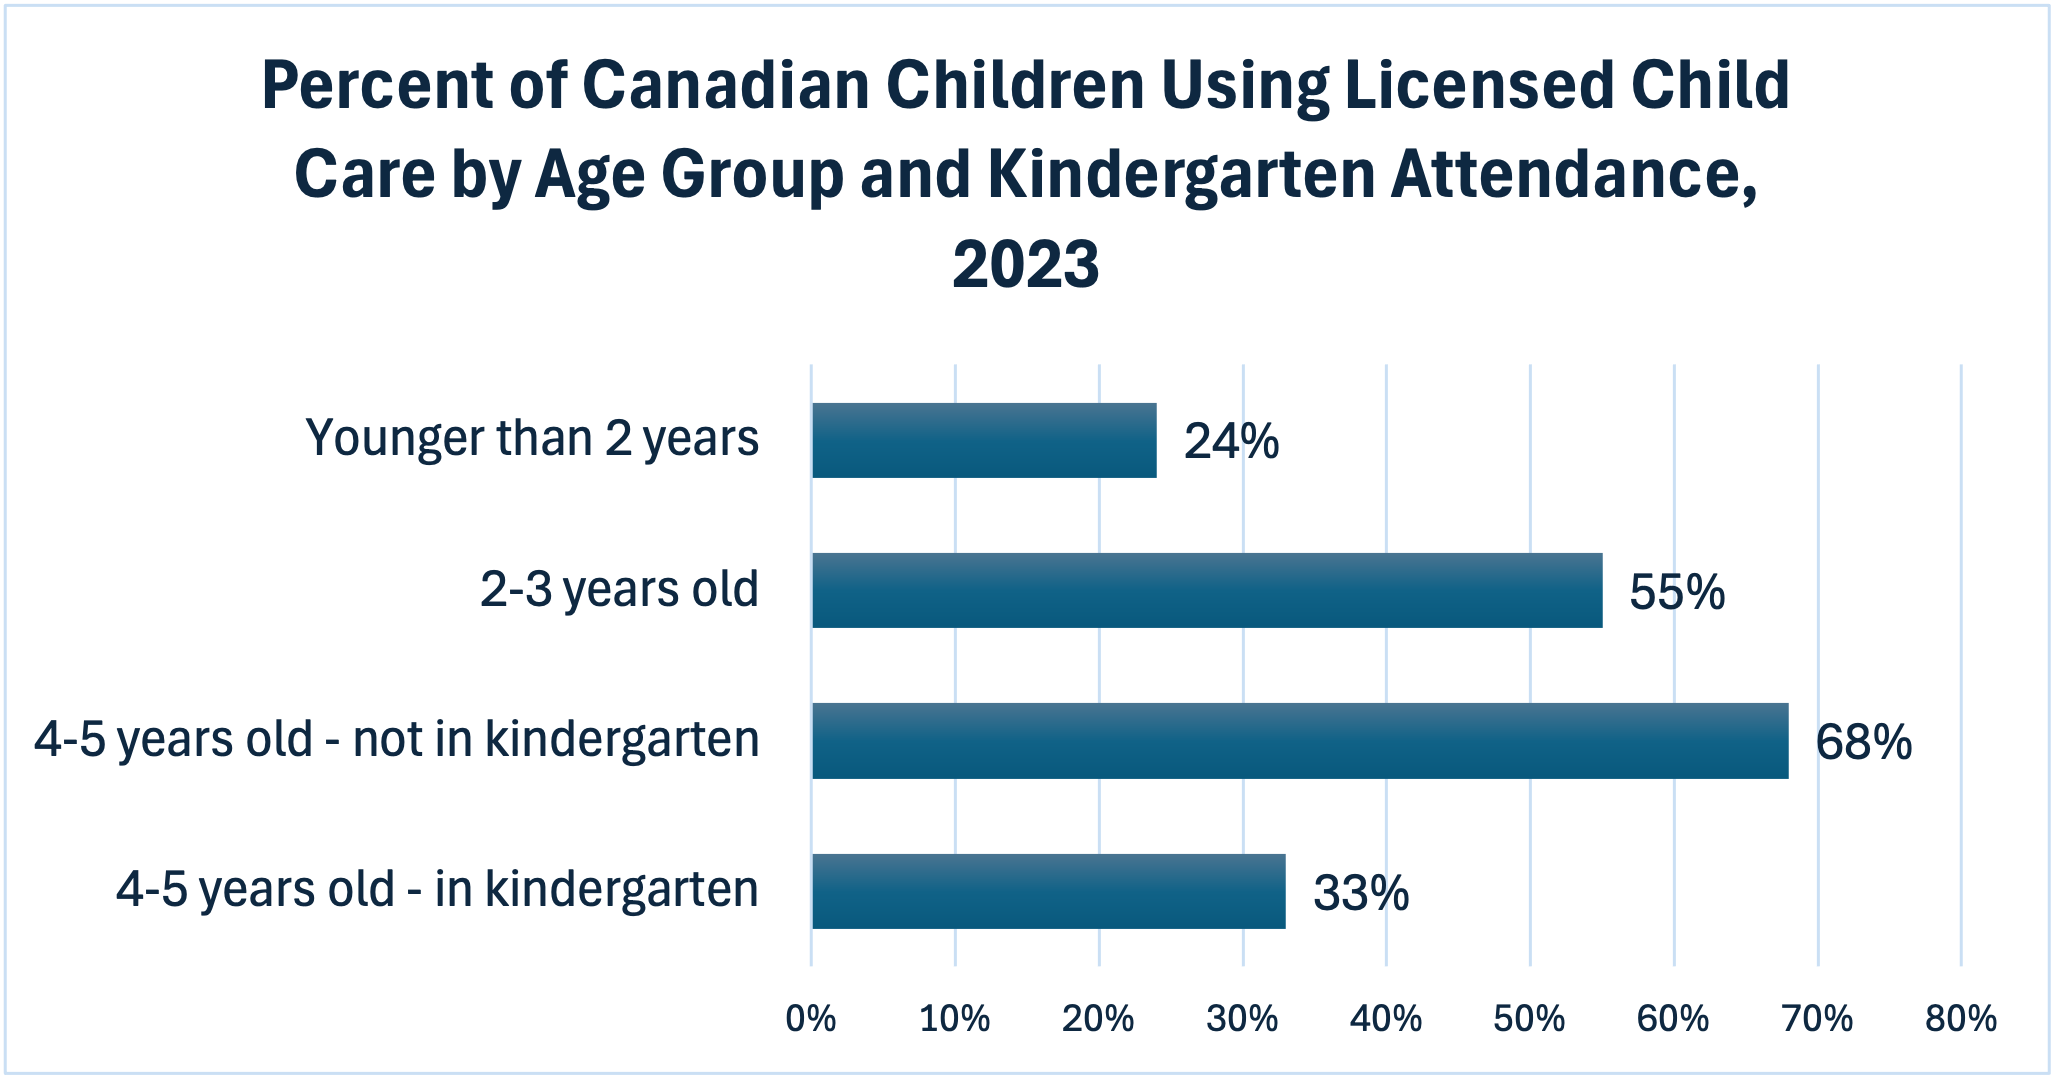
It’s true that there are a lot of children on waiting lists. Of course there are, because child care fees have fallen by 50% and more. But if you dig into the big parent survey that Statistics Canada conducted in 2023, you find that only about 16% of families are both on a waiting list and not already in licensed child care. You see, parents can be already using licensed child care and at the same time on a waiting list for a preferred licensed arrangement. Removing these still leaves a lot of children who need either new child care spaces or need existing spaces closed due to staff shortages to become operational – about 350,000 compared to the 927,000 children already in licensed care. We would need to increase enrollment by about 38% to eliminate these waiting lists and this, in my opinion, is where policy attention should be focused.
The Globe would have you believe that the “narrow focus on non-profit child care” is a big problem. Statistics Canada finds that about half of all child care centres serving children 0-5 years are for-profit businesses. Because non-profit child care is typically of better quality than commercial child care, the agreements signed between Canada and the provinces and territories call for new child care growth to be predominantly in non-profit, public and family child care facilities. Contrary to the Globe’s beliefs, this policy has not been a major barrier to for-profit child care expansion. Only 27% of new spaces since 2022 have been in non-profit facilities and another 16% in home-based child care. The rest of the expansion (57%) has been in for-profit facilities.
As you can see, most of the Globe’s analysis of the situation in Canadian child care is based on incorrect information. The Canada-Wide program is beginning to work – increased affordability, increases in child care capacity, increases in employment of child care staff, increases in the pay of child care workers, increases in the labour force participation of mothers with young children. It’s not fast enough and governments fight over who should pay the bills, but there is measurable progress.
The Globe has a point when it says: “Still, money is the main obstacle: There simply isn’t enough of it to keep fees this low and also create enough spaces to meet demand.”
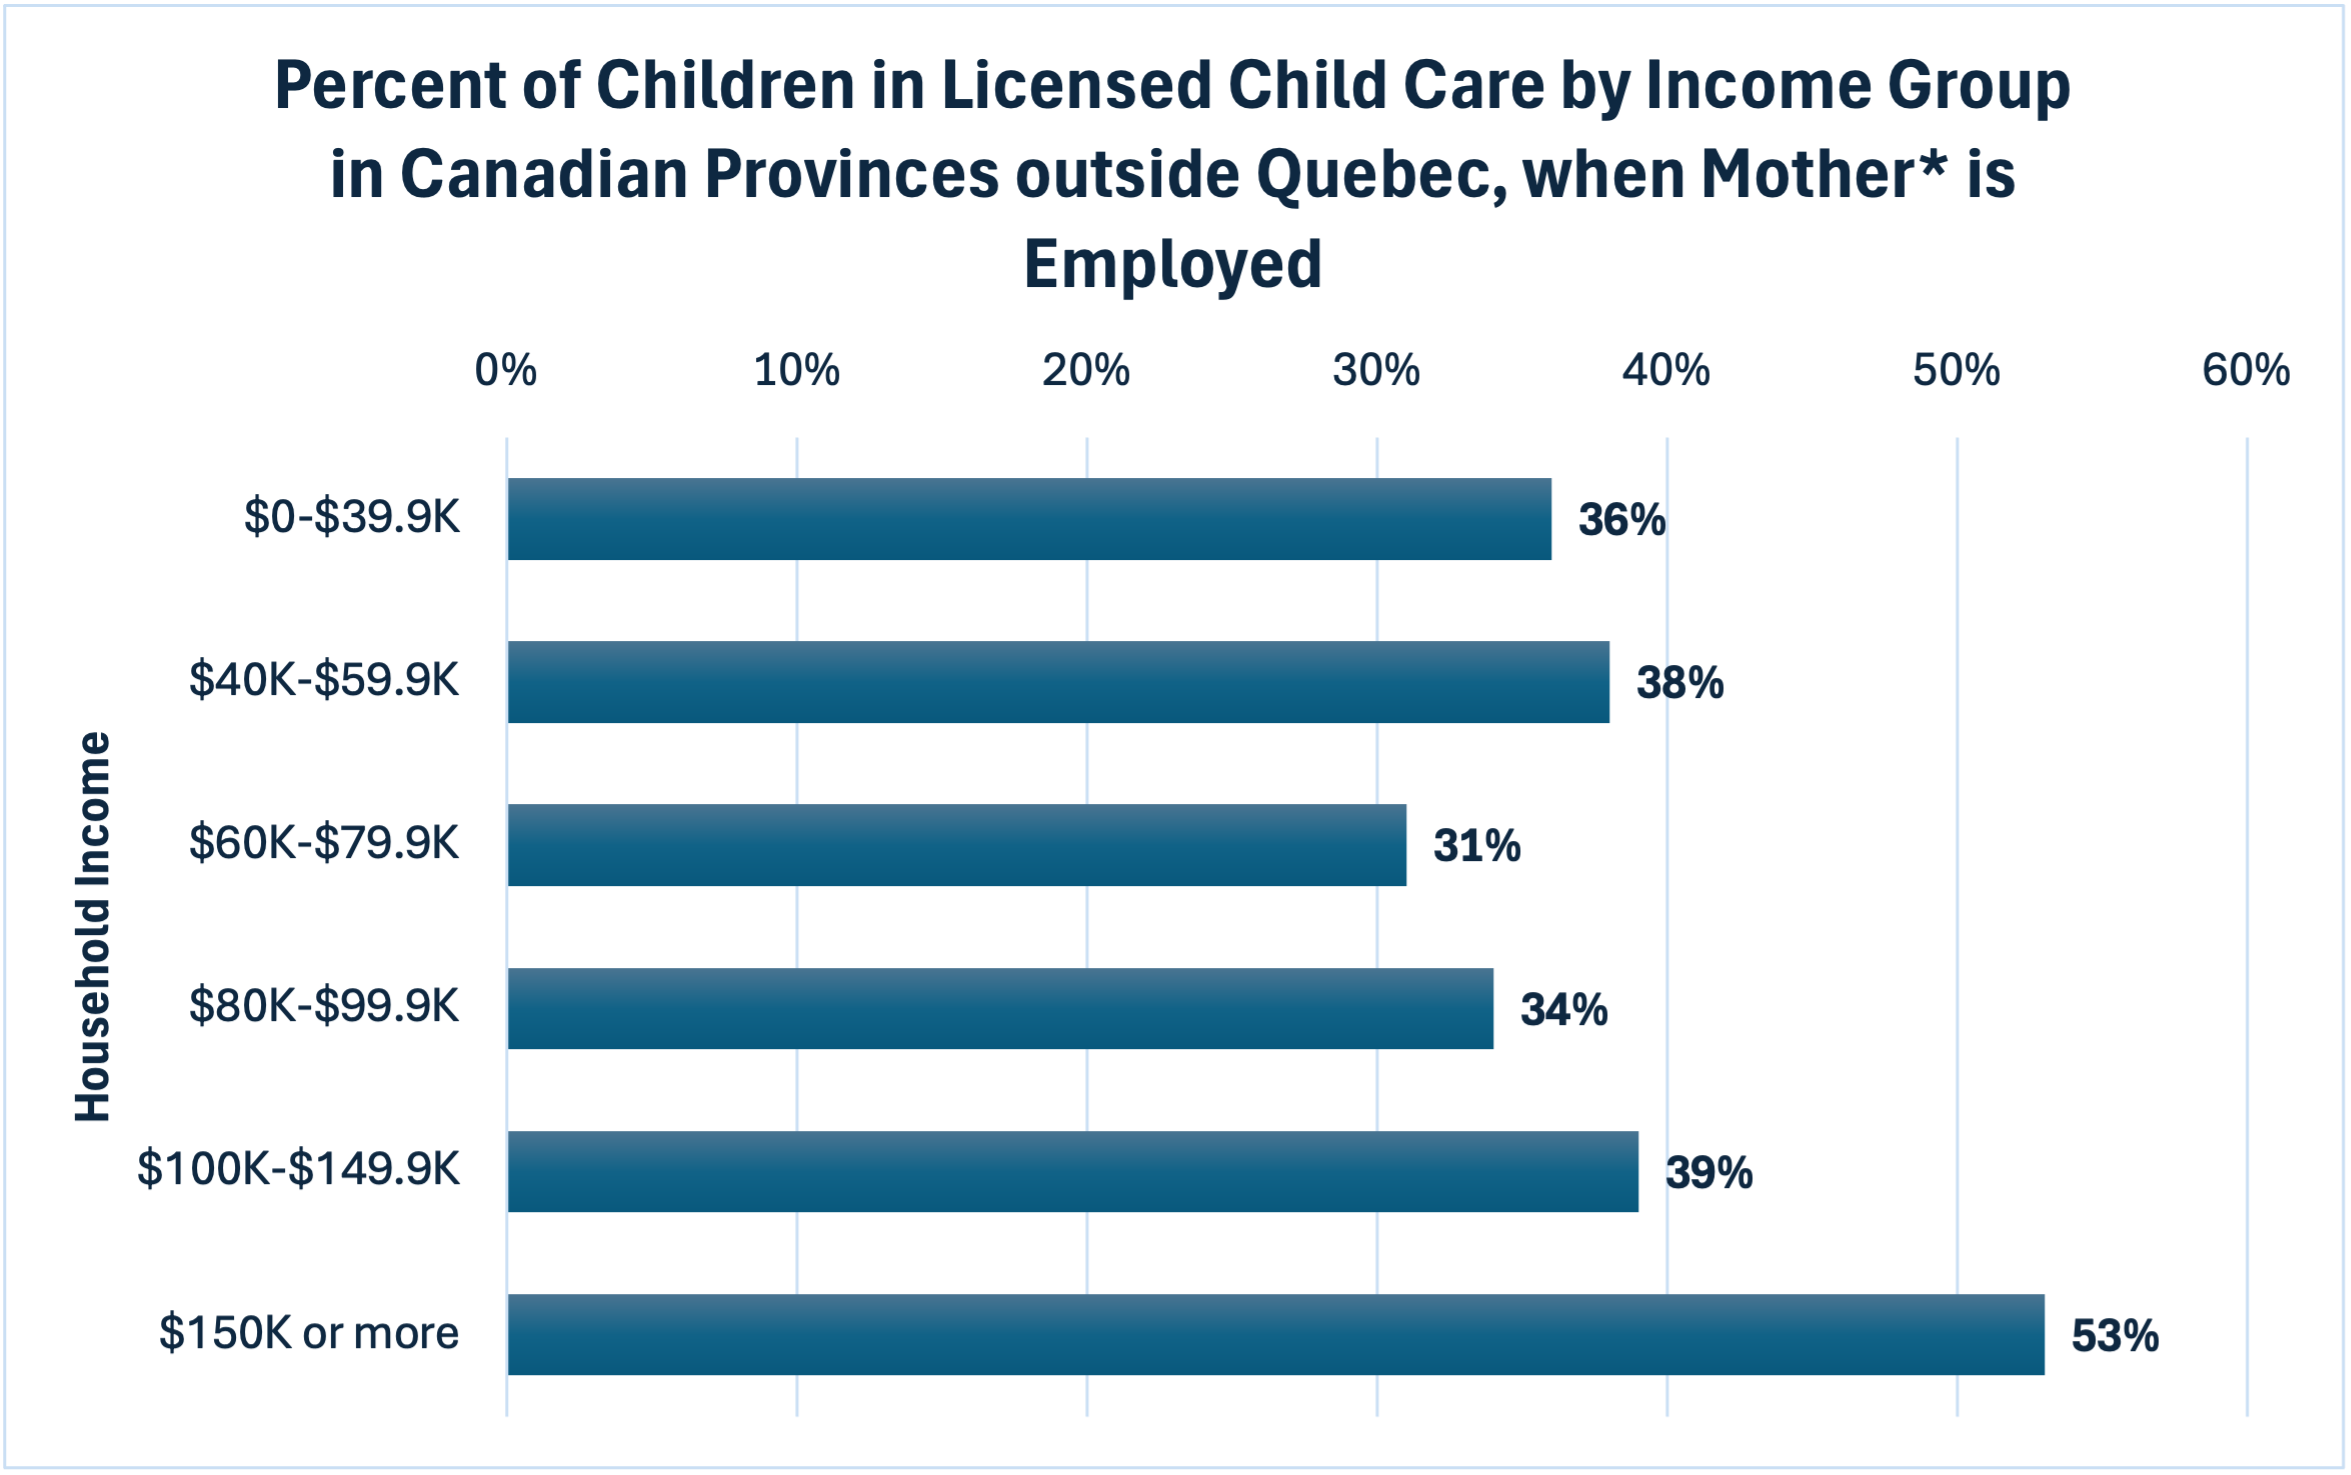
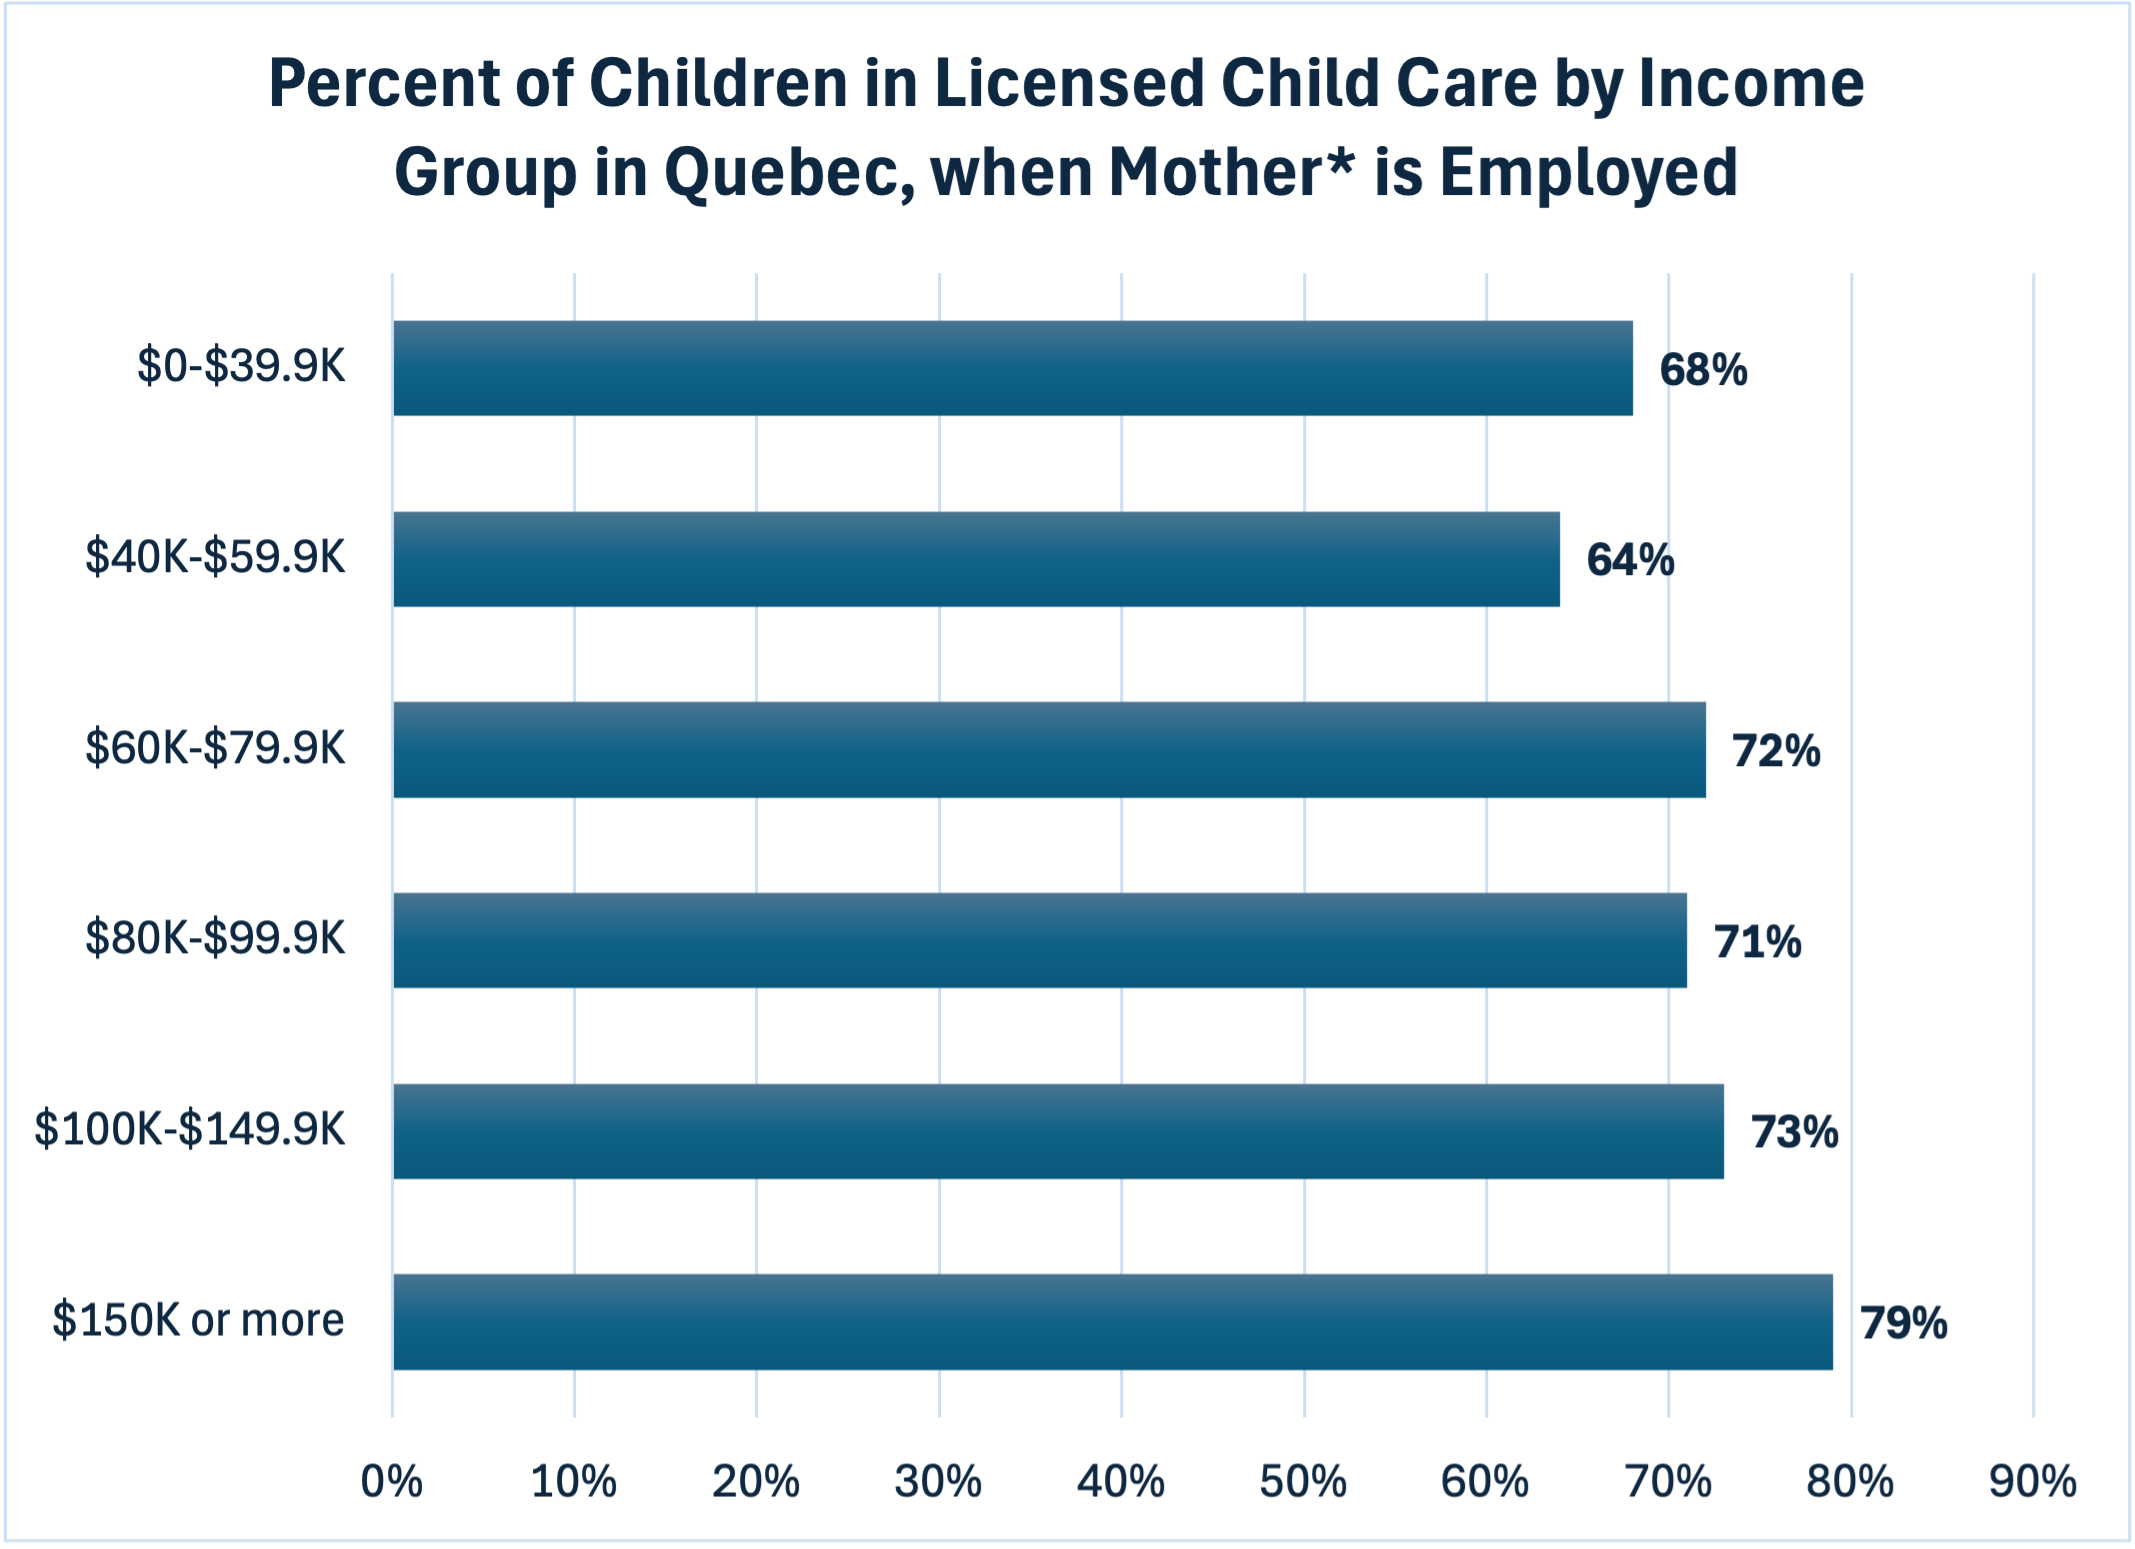
There is good recent evidence that governments would find spending on child care to be a wise investment. The Globe editorial refers to this: “Recent research based on data from Quebec, finds that when child-care subsidies help mothers join or stay in the labour force, the benefits last for the long term, with women working and earning more throughout their careers. This boosts tax revenue and reduces reliance on social assistance for decades after families stop needing child care.” But the Globe apparently thinks that this research only applies to mothers with low incomes. In fact, that research shows that universal child care, available to all mothers in Quebec, generates enough fiscal return to pay for itself. Quebec’s program encouraged many lower-income mothers into employment, but the fiscal payback comes disproportionately from the increased taxes on mothers who earn above the median. Universal child care may pay for itself. Heavily targeted financial assistance for child care will not.
Even if governments are currently cash-strapped, throwing away universal child care in favour of a narrowly targeted voucher would not make sense. The maximum child care fee in Ontario is currently $22 per day, rather than $10. Staying at $22 makes a lot of sense if money is too tight, as long as governments also have equitable and accessible child care subsidies for low-income families. Reaching $10 a day can wait for another day. The immediate priority is expansion.
Despite cherry-picking evidence from the C.D. Howe paper, they ignore one of its two key recommendations: “Ensure stable, long-term funding for the CWELCC system while promoting provincial accountability and progress toward consistent national standards.” Instead, the Globe and Mail plans to solve the money problem by cutting off financial assistance to many families. And they have the gall to claim in their editorial’s last line that their voucher/tax-credit plan will “provide a child-care spot for every kid who needs one.”