PARENT-ONLY CARE AND CHILD CARE ATTENDANCE BY CHILD’S AGE

56% of children 0-5 years of age across Canada use some form of non-parental child care on a regular basis. This is the finding of a large parent survey – Statistics Canada’s 2023 Canadian Survey on Early Learning and Child Care. However, nearly 980,000  or 44% – are cared for exclusively by their parents. This seems surprising to many, and apparently contrary to the notion that families need child care when their children are young.  However, when the data are looked at more closely, some of the reasons become clear. 

In the first year, or sometimes the first eighteen months of a child’s life, many parents are eligible for paid maternity and parental leave in order to spend time with their newborns.  According to the Statistics Canada data about 270,000 children or 12.1% of all 0-5 year-old children have a main caregiving parent who would normally be employed during the day, but is currently on maternity or parental leave. 

There are another 235,000 children, or 10.7% of the total who are 4 or 5 years of age and currently attend a different form of early childhood education – kindergarten – for much of each weekday. Kindergarten is not considered to be a child care arrangement by Statistics Canada, but kindergarten does provide care for children.  The large majority of kindergarten arrangements across Canada now cover the full school day, and often for 4- year-olds as well as 5-year olds.  Sometimes, before-and-after-school child care is available for these children, but not always at a low parent fee.  Many parents are able to adapt their work or school schedules so their children do not need any non-parental care other than kindergarten.

Another 475,000 children – 21.1% of all 0-5 year-old children – do not have parents on leave and are not in kindergarten, but in any case are cared for entirely by their parents. Close to half of these children – about 202,000 – have a main caregiving parent who is currently employed.   Parents may cover child care needs while they are at work through off-shifting between parents (parents working or studying different shifts so one can always be with the child).  Or one parent could be providing care while working from home. About 55,000 of these children were on a waitlist for child care in 2023. 

A bit more than half of these children – about 269,000 – have a main caregiving parent who is not currently employed.  About 41,000 of these children were on a waiting list for child care.

In sum, the picture of children in parent-only care is a complex mix of different situations in which parents currently do not use child care.  Many of these children will use or have used child care and kindergarten at different ages, but are not currently using child care.


CHILD’S AGE

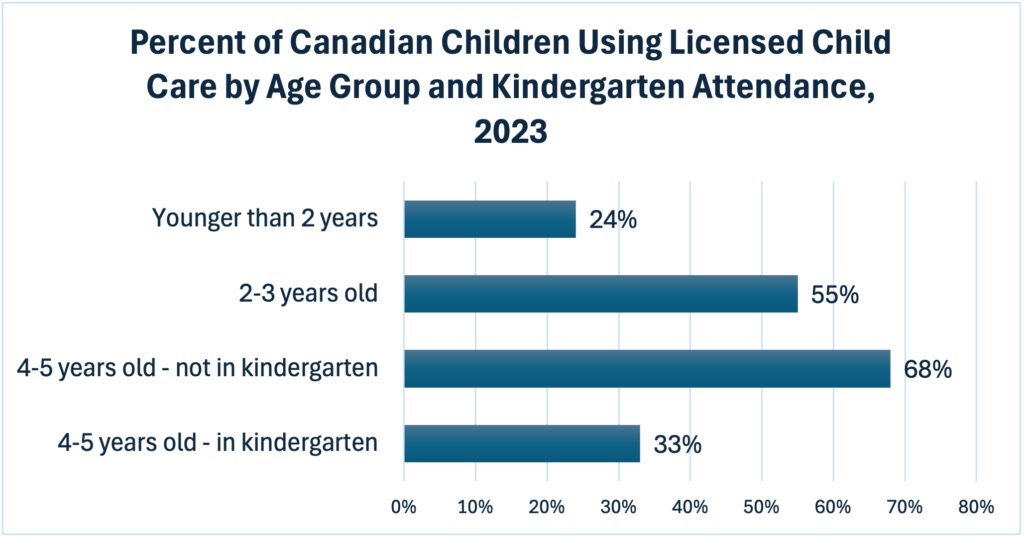
The likelihood that children participate in  licensed child care is strongly affected by the child’s age.  Only 24% of children who are less than two years of age (0-1 years) currently use licensed child care. This is, perhaps, unsurprising because so many parents take a year (or in some cases, eighteen months) of paid maternity and parental  leave when children are first born.

However, 55% of Canada’s children who are two or three years of age are in licensed child care. When children are four or five years of age but not yet in kindergarten, 68% currently use licensed child care.  For children who are four or five years of age and are currently attending kindergarten during the day, 33% use licensed child care.

The use of parent-only care also varies strongly by child age.  62% of children who are less than two years of age (0-1 years) are cared for only by their parents.  This falls to 30% when children are 2-3 years of age and 22% when children are 4-5 years of age and not yet in kindergarten.  For 4-5 year-olds who are already in kindergarten (full-school-day in most provinces), parent-only care is the main complement to kindergarten for about 51% of children.

HOW MANY CHILDREN ARE USING LICENSED CHILD CARE?

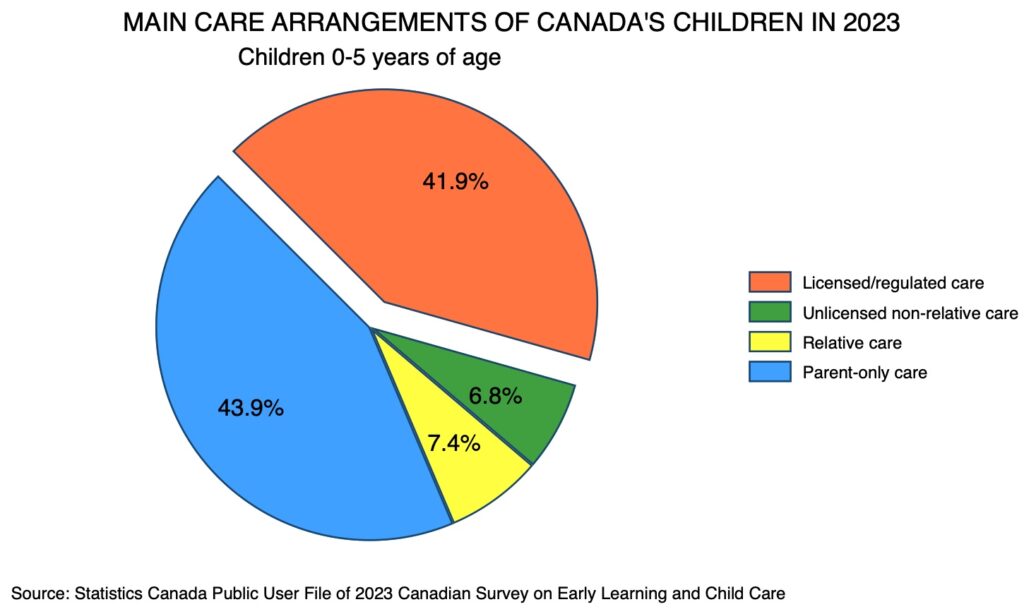
According to recent data, 938,200 children are regularly attending licensed or regulated child care services across Canada (not including the Territories).  That is about 42% of Canada’s children 0-5 years of age who used licensed child care as their main care arrangement in 2023.  A much smaller proportion of these young children (6.8% and 7.4%) respectively) are using unlicensed child care provided by a non-relative or care by a relative as their main arrangement.

The data comes from Statistics Canada ‘s Canadian Survey of Early Learning and Child Care, which collected data about child care arrangements from nearly 30,000 parents in 2023.  The Public User Microdata File gives us the results shown here.

Nearly 44% of children 0-5 (982,910 children) are, for various reasons, not currently in child care.  Close to half of these are children whose parents are currently on maternity or parental leave or are 4 or 5 year-old children attending kindergarten, often for a full school day. 

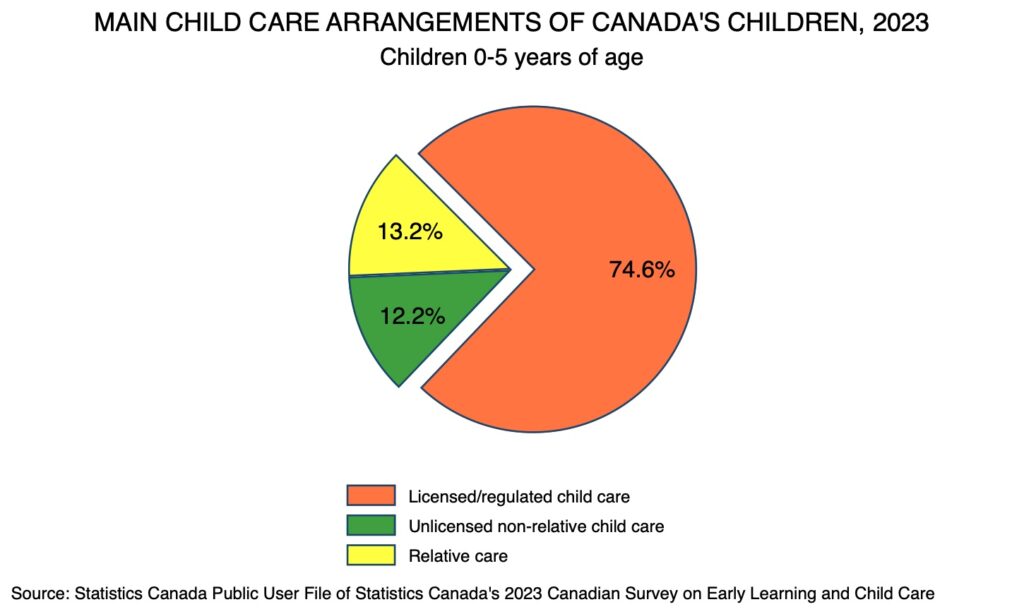
Licensed child care is now the dominant type of child care arrangement that parents choose for their children 0-5.  Of children using any type of non-parental child care arrangement, 75% use licensed care. 

How is CWELCC Doing? A Response to Peter Jon Mitchell

This week in the Hill Times, Peter Jon Mitchell says he wants to get rid of the $10 a day federal child care program.  But too many families now love it and depend on the increased child care affordability that has made their lives better.  So instead Peter Jon argues that the Canada Child Benefit or the Child Care Expense Deduction should be amended to provide child care assistance to those who can’t find child care.  But neither solution would be much help.  The Canada Child Benefit goes to nearly every family independent of whether they want to use any form of child care so this would be a very expensive way to deliver assistance.  And the type of tax credit that Peter Jon would use to replace the Expense Deduction has been an unmitigated disaster for child care quality in Quebec, as the charts below show.

Peter Jon hopes to convince us that the federal child care funding program is a complete failure and shambles, so he throws as much mud as possible at the wall to see if any of it will stick.  He has these complaints about the program:

  1. Space creation is difficult because the child care agreements favour expansion predominantly in the not-for-profit/public/family child care sector
  2. Many existing licensed spaces are empty or not operating
  3. Most children under six years of age don’t benefit from the program
  4. Only 71% of centres are in CWELCC – the federally funded program
  5. The program breeds inequality. Child care enrolment by low-income families is declining – by 31% in Ontario.
  1. Not-for-profit

The not-for-profit issue has been tested in practice.  As Peter Jon reminds us  “Quebec’s daycare program, upon which the CWELCC is modelled, has long depended on private, for-profit childcare businesses.”  It’s true that since about 2010, Quebec has relied on a tax-credit-funded expansion of for-profit child care operators.  There are three types of centres in Quebec. There are the CPEs which are not-for-profit community-based centres that charge a flat fee less than $10 a day.  There are the funded for-profit child care centres (shown as GS on the charts) that also charge the low flat fee. There are the tax-credit-funded child care centres that grew since about 2010, shown as GNS on the charts.

It might surprise Mr. Mitchell to hear that Quebec Families Minister Mathieu Lacombe told the Globe and Mail in 2022 that “allowing for the expansion of private daycares was the biggest mistake that the Quebec government committed in the last 25 years.”   And the Quebec Auditor General has shown us why in her 2023-24 report, reflected in the charts below. 

The first chart shows us the results for on-site quality evaluations by the Ministry.  The other shows us the percent of centres that fail to meet the current requirements for fully-qualified staff (which is one out of every two staff).  Together they indicate that for-profit child care, which seems to be Peter Jon’s preference for the rest of Canada, is much lower in quality and cuts costs by avoiding hiring the required numbers of qualified staff, compared to the not-for-profit CPEs. 

So, yes, there are good reasons to want space creation to take place predominantly in the not-for-profit and public sectors.  Relying on for-profit expansion may seem faster and cheaper in the short run, but at what cost for our children’s future?

  1. Enrolment

It’s true that there are too many existing licensed spaces that are empty or not operating.  The Auditor General of Ontario found this was true of 27% of the funded spaces in Ontario, but it is also true elsewhere.  The substantial majority of this is due to staffing shortages.  Early Childhood Educators in most of Canada require a college education to be a fully-qualified educator, but they earn wages that are surprisingly low.  As a result about half of all new hires in child care do not stick around for very long.  Recruitment and retention of staff both fall well behind what is needed. 

However, empty spaces suggest a solution different from Peter Jon’s – raise educator wages and benefits closer to the average wage in the province or territory.  I’m sure that many trained educators currently working in retail and elsewhere will come flooding back to allow the spaces to open.  Families would be happy, educators would be happy and the child care system would be more stable.  The number of parents having difficulty finding child care would drop fast.

  • How many children benefit?

Peter Jon says that most children in Canada don’t benefit from CWELCC.  CWELCC is intended to be a universal program, but that doesn’t mean that everyone will want to use child care from their child’s birth through until school.  Many families take a year or more off after a child’s birth using maternity and parental leave to spend time with their infant.  Many families live in jurisdictions with full-day kindergarten, sometimes for both four and five year olds and don’t need additional child care beyond that.  Some parents want to stay home with their young child and do not need child care. 

If we looked only at families where the main caregiving parent was employed, was not on maternity/parental leave, and whose child was not in kindergarten, then already in 2023, 62% of Canadian children were enrolled in and attending some form of licensed child care across Canada, most of it receiving federal funding.  We still have a way to go to serve all children who need or want good quality affordable child care, but we’re much farther forward than Peter Jon says we are.

  • Is it true that nearly 30% of centres are not in CWELCC?

In fact, there are very few eligible centres not enrolled in the CWELCC program.  Mr. Mitchell should be more careful with his “facts”. 

The source he cites looks at centres serving children 0-12. This data source says that only 71% of centres said they were enrolled in CWELCC.  But many of these centres serve only school-age children and these centres are not eligible to get federal funding, which is only for children 0-5. 

Ontario is the province (outside Quebec) with the largest number of centres that are not part of CWELCC and as of March 31, 2025, 91.8% of all centres serving children 0-5 in Ontario were enrolled in the CWELCC program.

  • Child care enrolment by low-income families

This is a serious issue, but Peter Jon misunderstands it.  It is true that the Auditor General of Ontario recently found that the number of children receiving child care subsidies in that province has declined by 31%.  But that is compared to 2019 before CWELCC started, and the decline in subsidies before Ontario signed onto CWELCC was more rapid than since that time.  

 There is a legitimate worry that not enough low-income families will be able to access newly available spaces.  The Auditor General cited favourably a program in one region where a percent of spaces in each centre are reserved for children receiving child care subsidies.  This might be a useful reform that I hope Peter Jon would support.  Already, there has been a strong prioritization for child care expansion in Ontario to favour underserved areas with more vulnerable populations.

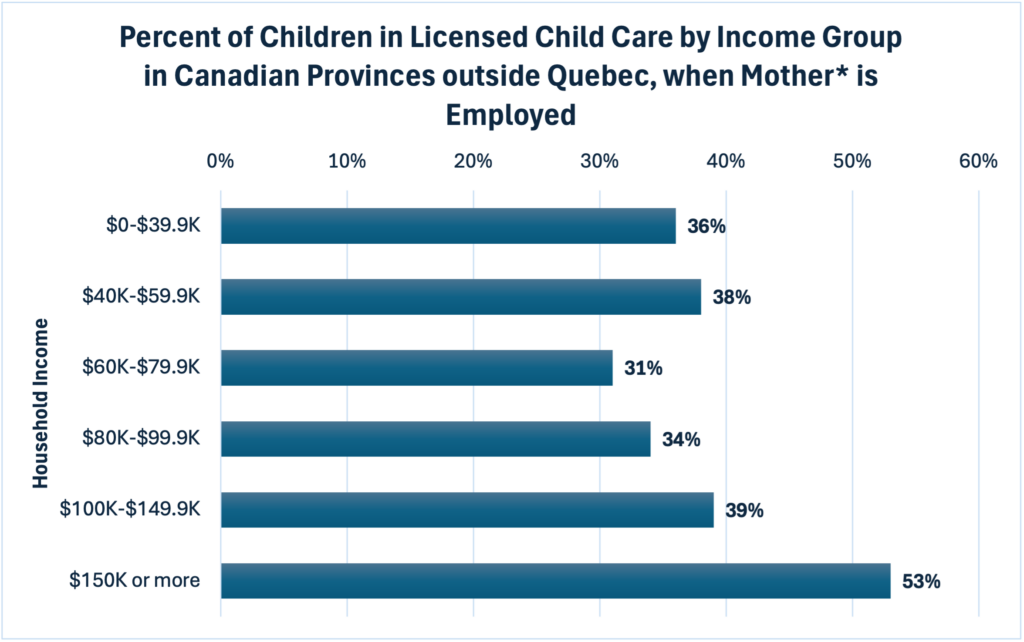
However, rather than look only at subsidies, there is more comprehensive data on child care use by family income that comes from a 2023 parent survey done by Statistics Canada.  Here’s what it shows:

The data suggests, yes, that access to licensed child care by lower income families is not as high as for the more affluent.  But the differences are probably smaller than you thought they were.  I don’t mean to minimize the issue.  Most studies show that children from lower-income or vulnerable families are especially likely to benefit from quality child care.  So working on this issue is a high priority.  However, the sky is not falling.  It is just a persistent problem that provincial and territorial  child care systems need to address.  In fact, it is a persistent problem in child care systems, no matter how they are funded, often less so the more universal the service is.

Instead of trashing the $10 a day child care program, maybe Peter Jon Mitchell should spend his time lobbying the Alberta Government to re-instate the child care subsidy system that they completely eliminated  this year!  This will definitely hurt lower and middle income families in Alberta.  The Alberta Minister complained at the time that federal funding regulations did not allow him to fund a targeted program like child care subsidy.  However, he had a subsidy system receiving federal funding ever since signing the CWELCC agreement with Ottawa, and nearly all other provinces have child care subsidy systems, so that excuse is untrue.  Alberta should re-instate its subsidy system as part of its CWELCC funding. 

What is to be done?

The $10 a day child care program is only partly developed and is far from perfect.   Much more affordable licensed child care is now wanted by many more parents.  Of course.  And expansion of services is too slow. There is little capital funding and too little planning for expansion of not-for-profit child care.  Also, crucially, child care wages in most provinces are too low to attract qualified educators. 

Making child care more accessible is central to the health of the program.  I hope Mark Carney recognizes that in the upcoming budget.  After all, isn’t a universal child care system a pillar of the new economy that families with children need – the kind of nation-building project that will make Canada stronger, fairer, and more affordable?

    8 things to know about $10-a-day child care

By Martha Friendly, Executive Director, Childcare Resource and Research Unit, and

Gordon Cleveland, Associate Professor of Economics Emeritus, University of Toronto Scarborough

  • Many more children are in licensed child care (especially centres) now than before the $10-a-day program

In 2023, 177,900 more 0-5 year olds were reported by Statistics Canada to be in child care centres than at the end of 2020 just before the $10-a-day program began. 

  • Nearly a million Canadian 0-5 year olds already benefit from low-fee licensed child care

938,000 children are using licensed child care that is eligible for the $10 a day program, according to 2023 Statistics Canada. If we add four and five year olds in kindergarten, and children at home with parents on parental leave, a total of 1.5 million young children are benefitting from public programs that support the care of young children as well as mothers’ employment and family incomes.

  • There is considerably more licensed child care than ever before

Between 2015 and 2023, the number of child care spaces for children 0-12 grew by 426,203 to a total of more than 1.6 million licensed spaces, despite the negative effects of the pandemic on child care services and mothers’ employment.

  • For the first time ever, child care has been made affordable for parents across the  income spectrum

In eight provinces and territories (including Quebec), parents now pay $10-a-day or less for licensed child care. In the other jurisdictions, fees have been substantially reduced by provincial/territorial fee reduction or are provincially set. The fee changes mean that parent fees are between one-sixth to one-third of the fees before the $10-a-day program, depending on the province/territory.  In addition, all provinces and territories except Alberta have fee subsidy programs to lower child care fees further for parents with particularly low incomes.

  • Waitlists for licensed child care were always long but have grown
    Although nearly a million Canadian children are benefiting from low-fee child care, there are too few licensed spaces and many families are still on waiting lists. Nearly 50% of child care users reported difficulty finding a space in 2023— about 10% more than the nearly 40% reporting difficulty finding care in 2020 before the CWELCC program began. 

Many employed families who use other child care arrangements can claim financial  assistance from the Child Care Expense Deduction, and most families with young children also receive the Canada Child Benefit – income support to help families with child rearing costs.

There is good agreement that provinces and territories must speed up expansion of spaces and hiring of qualified staff to reduce waitlists. To support this, federal government has made $625 million for child care infrastructure available to provinces and territories and allocated $1 billion of low-interest loans and grants for child care expansion to be distributed by the Canada Mortgage and Housing Corporation.

  • The $10-a-day child care program is very popular with parents, so demand for licensed child care, especially centres, is high.

Already in 2023, three-quarters of children in any form of non-parental child care were in licensed child care. On top of this, a majority of those not currently using any non-parental child care said they would like to use it too. Of these, 62% would prefer to use a child care centre.

  • For-profit providers are not being driven out of business

Mr. Poilievre claims that for-profit child care providers are being driven out of business. Agreements signed between the federal government and the provinces and territories included all existing child care providers willing to lower parent fees and provide accountability in exchange for very substantial, reliable public funding.

For-profit providers unwilling to participate in the low-fee program may set their own fees instead of relying on government funding.  The agreements with provinces and territories specify that new spaces should be primarily in not-for-profit or public centres or in licensed family child care homes. This protective provision is intended to ensure that higher profits should not be the predominant rationale of a system of publicly funded services for children and families.

  • Pierre Poilievre’s “freedom and flexibility” child care policy would raise child care fees

Opponents of publicly funded universal child care claim that the $10-a-day plan is a bad idea—“a massive top-down bureaucratic system”, “one-size-fits-all”, and “worse today than when the Liberals took office”, arguing instead for payments to parents. Pierre Poilievre’s alternative is “more flexibility and freedom for parents, provinces, and providers”.

In other words, Mr. Poilievre’s alternative would allow provinces to eliminate the $10 a day program. Instead, providers will have the flexibility and freedom to set their own parent fees, and provinces will have the flexibility and freedom to use federal funds to support unregulated child care or favour for-profit operations. Slashing red tape will mean child care providers will no longer need to account for how they spend billions of dollars of funding.

Mr. Poilievre’s alternative is to go back to the previous scarce-space, high-fee, market-model child care. This didn’t work during the nine years in which the Harper government (of which Mr. Poilievre was a member) tried out its market model, and it won’t work now. 

April 14, 2025

Is Minister Jones Going To Take Away Your Affordable Child Care?

It’s Family Day in Alberta today (February 17th).  And Matt Jones, Minister responsible for child care in Alberta,  apparently wants to celebrate by making plans to leave the child care agreement  that will bring $15 a day child care to the province on April 1st.  And he wants to blame the federal government while he does it.  But the truth is, most decisions about child care in Alberta are entirely in the hands of the provincial government.

Take the cancellation January 30th of Alberta’s child care subsidy program that helps low-income families.  Matt Jones cancelled it, as part of the move to a flat child care fee of $15 a day.  He didn’t have to do that.  Every other province and territory outside Quebec has a child care subsidy program targeted at low-income and otherwise vulnerable families as part of their move to $10 a day. Alberta’s agreement with Ottawa committed to an “average fee of $15 a day” in 2024-25, not a flat fee of $15.   Why did Alberta have to cancel the subsidy payments?  No reason at all. 

And then Minister Jones had the gall to say that Alberta might have to withdraw from the $10 a day program because the federal government doesn’t allow him to target support to parents that need it the most. In an interview with LakelandTODAY.ca, the Minister said:  “The current federal agreement is not flexible to allow us to income test, say households earning under a certain amount of income.”  Which is plainly untrue.

In a Facebook post, Minister Jones cited other reasons for planning to withdraw child care support from Alberta families.  He said that the program is underfunded by Ottawa, by more than $4 billion over the next few years and that the child care agreement that Alberta voluntarily signed back in November 2021 is “unfair to the majority of child care providers”.

This week the federal government offered Alberta and other provinces the chance to extend existing child care agreements for another 5 years and receive more money to do so.  But, Mr. Jones wants even more money and he wants flexibility.  And if he doesn’t get it, Alberta will pull out of the $10 a day child care program.  As he puts it in government-speak, Alberta “will be forced to transition out of what is, and will be, an unsustainable program.” 

In 2025-26, Alberta will be getting nearly $1.1 billion through this agreement to support low-fee child care.  In its agreement with Ottawa, Alberta calculated that it could lower fees to $10 a day for 134,691 children for a cost of much less than that – for $829.93 million.  What changed? Unless Alberta child care costs are completely out of control, there should be enough money right now.  So, why not sign on to continue the program? 

Minister Jones real reason for being willing to take away your low-fee child care comes down to “flexibility”.  “Flexibility” is a code word.  In 2021, Alberta agreed to expand home child care and not-for-profit child care spaces by 42,500 and for-profit child care spaces by only 26,200.  Two-thirds of Alberta’s child care spaces are commercial now, so extra expansion of non-profit facilities would provide some balance and choice for families.  Minister Jones wants to wiggle out of that agreement.  That would be called “flexibility”.  Apparently, the evidence that non-profit child care services are stronger promoters of high quality is unimportant to Minister Jones. 

Frankly, Minister Jones reasons for not signing on to continue the $10 a day child care plan are flimsy.  I think he is in the pocket of that portion of commercial operators who want to be able to charge whatever fee they want, and earn whatever profit amount they can get away with.  He might call that giving money to parents in the form of a tax credit.  But we know that it means no more limits on parent fees – no more $15 a day child care or $10 a day child care.  And that would mean unaffordability for parents.  Not a good plan.

The purpose of the $10 a day agreements between provinces and territories and the federal government is to ensure that low-fee child care services are available to families and children when and where they want them.  Not every family wants to use child care throughout a child’s early years.  But most Alberta families use child care for some time as their children grow.  For instance, 61% of Alberta’s children who are 4-5 years of age and not yet in kindergarten use licensed child care.   Many more want an expansion of low-fee child care services.  In my opinion, Minister Jones should sign on to continue the $10 a day child care funding for Alberta parents and children.

A NEW STATISTICS CANADA REPORT ON CANADA’S CHILD CARE WORKFORCE

One of the main barriers to expansion of child care supply is a widespread shortage of qualified educators.  This is mostly due to wages and benefits that are insufficiently high to attract and retain staff.  As a result, there are long waiting lists to get into licensed child care (115,000 children with mothers whose main activity is paid work). 

We do not have much good current data on our child care workforce, but Statistics Canada is attempting to begin to fill that hole.   Towards the end of December last year, Leanne Findlay and Thomas Charters from Statistics Canada published a report on child care workers who care for children 0-5 years of age.  The data is from 2021-22 and its source is the 2022 Canadian Survey on the Provision of Child Care Services (CSPCCS).

The authors restrict the sample to look only at centres who provide child care to children 0-5 years of age, and they address several issues:

  • Centre employees –  hours, training and roles
  • Typical rates of pay
  • Numbers hired, departed and staff vacancies
  • How all of the above vary by auspice and organizational structure

There are some important findings and observations in this study.   The study reports on weighted results for nearly 12,000 centres serving children 0-5.  Nearly half (48.6%) of child care centres serving children 0-5 are for-profit.  Centres employ nearly 137,000 staff, including full-time and part-time, program staff, supervisors, and support staff.  Nearly 90,000 of these employees are in Ontario and Quebec, and close to 15,000 each in Alberta and B.C. About 38% of these staff are hired in multi-site centres and about 62% in single-site centres.

A typical centre has about 56 children and close to 12 staff.  About 8 of these are front-line program staff.  There are either 1 or 2 supervisors and between 1 and 2 support staff.

Staff Qualifications

Most centres (83%) have a supervisor with an ECE certificate, diploma or degree.  For-profit single-site centres are below this average at 77%.

50% of centres have at least one staff member with no ECE training, and in those centres on average there are 3.7 staff members with no training.  47% of centres have at least one staff member with training of less than one year and on average in those centres there are 3.1 staff members with this modest level of training.  88% of centres have at least one staff member with a one-, two-, or three-year ECE certificate or diploma and these centres have on average 6.5 staff members with this level of training.  Finally, 17% of centres have at least one staff member with a four-year ECE degree or higher and on average these centres have 4 staff members with this level of training/education.

Wages

Survey respondents provided information about the most typically paid hourly wage rates for different categories of staff.  The average for supervisors was $27.80 per hour, but for-profit centres paid between $25 and $26 typically, and not-for-profit centres on average paid between $29 and $32. 

The same pattern was seen for wages of staff with an ECE credential – the for-profits paid an hourly average wage of between $20.50 and $21.50.  The not-for-profits paid between $22.50 and $23.00. 

Unfortunately, the wage question asked respondents to include wage enhancements but not provincial top-ups when reporting on staff wages.  This may have resulted in underreporting of wages in some centres.     In any case, it is obvious that typical wages in the sector are rather low.

Benefits

Amazingly, only about 76% of centres report that they provide any benefits at all to centre employees!  Those benefits include supplementary health and dental plans, life or disability insurance, pension plan contributions or group RRSPs, paid sick leave, paid vacation leave and financial assistance or paid time for training. 

The provision of benefits varies a lot by auspice and organizational structure.  Only about 62% of the single-site for-profits have any employee benefits.  Between 78% and 79% of both the multi-site for-profits and the single-site non-profits offer some employee benefits.  On the other hand, 93% of multi-site non-profit centres have at least some employee benefits. 

The biggest gap appears to be in pension benefits.  Only about 20% of for-profit centres of either kind have some pension or RRSP benefits.  About 46% of single-site non-profits have these benefits and 63% of multi-site non-profits do, as well.

Vacancies

The survey also provides information about job vacancies experienced by centres.  In April 2022, there were 7,560 vacancies in centres for ECE positions and another 2,960 vacancies for non-ECE positions.  In other words, nearly 8% of staff positions were vacant.  No wonder expansion of services has been slow and difficult.  In fact, 35% of centres had at least one vacancy for an employee with ECE credentials or training.

All of these issues are good ones to look at and the authors have done a good job with the data, but there are problems that affect interpretation and clarity.  In particular, the data is cross-Canada data; the sample size was too small to break responses down by province and territory. 

Further, CSPCCS is not a survey of members of the child care workforce, with questions answered by each staff member.  Instead, the CSPCCS is a survey of centres, so the respondent is some representative of the centre, and the responses are statements about the whole centre, not about the individual staff member.  So, there is less detail than you would like in some answers.  As an example, the categories for staff qualifications are (1) No ECE-related training, (2) ECE training of less than one year, (3) one, two or three year ECE certificate or diploma, (4) Four-year ECE degree or higher.  So, we can’t see how many staff have certificates vs. diplomas.  That’s potentially a very important difference.

The information is useful, but we still need a workforce survey where the respondents are individual supervisors, educators and assistants (and perhaps support staff as well).  That kind of survey, with a large enough sample, would allow us to get more detailed information about qualifications, remuneration, and recruitment and retention issues. 

A Fact-Based Response to Cardus’ Odd Assertions

Since its beginning, Canada’s plan to build a system of child early learning and child care – the “$10 a day plan” –  has been panned by a handful of players. These include spokespeople for some political parties, some child care centre owners, right-wing “pundits”, and social and economic conservatives, all with their own agendas. Relying on misrepresentation of research literature, misinterpretation of public opinion polls and Statistics Canada surveys, the common agenda is to paint the $10 a day plan as a “failure” and “disaster” rather than the first largely successful phase of a Canada-wide project to build a workable child care system for all families and children over time.  (Really, it is the second phase because back in 1997, Quebec began to build a largely successful and largely universal low fee child care system of their own).

This blog comments on a policy brief published  by Cardus in November 2024.  Cardus advertises itself as a non-partisan Christian think-tank; it takes a socially conservative approach and promotes ways of thinking that pre-date the Royal Commission on the Status of Women that reported in 1970.

Cardus would have you believe that very few Canadian children and families benefit from low fee licensed child care.  Cardus’ staff members Mitchell and Mrozek have written that: “…most Canadian families receive no benefit from the billions spent – only 29% of children aged 0-12 had access to a licensed space in 2021.”  (November 2024).  It’s a pity that Mitchell and Mrozak inappropriately use data on children 0-12 years to reach this conclusion.  Most of these children (the 6-12 year olds) are not even covered by the new funding programs to make child care universally affordable for families.  Cardus should instead have informed themselves with the latest Statistics Canada data (the parent survey in 2023 that looks at children 0-5 years of age).  It’s called the Canadian Survey on Early Learning and Child Care.  Or, Cardus could have read the report entitled Giving Parents Money Doesn’t Solve Child Care Problems published by the Prosperity Project in September 2024.  It provided much of the same data we include in this blog.

Many families already benefit from low fee child care

If Cardus had consulted the appropriate data, they would find out that the truth is somewhat different from their biased conclusion.  The latest data are from 2023, two years after the beginning of the $10 a day program and about 25 years since Quebec began phasing in universal child care.  There are about 2.2 million children 0-5 years of age in Canada and close to a million of them (938,000 children or 42% of all children) are already using licensed child care

Families prefer to use licensed child care

In fact, 75% of the children 0-5 years of age who use any kind of non-parental child care in Canada now use licensed child care.  About 1.25 million children 0-5 regularly use some form of non-parental child care and 938,000 of them are using licensed child care.

Licensed child care provides strong support of parental employment

A major reason why governments in Canada are spending billions of dollars to provide low fee child care is to support parental employment.  And this support of parental employment is happening.  According to the recent Statistics Canada parent survey, 59% of parents (mostly mothers) whose main activity is working at a paid job or business already use licensed child care for their young children.  Many others – another 115,000 who are on a waiting list – would like to use licensed child care and will happily do so when more supply becomes available.

Child age and availability of kindergarten explain patterns of use of licensed child care

The demand for licensed child care is strongly related to the child’s age.  Parents with  children less than two years are less likely to use licensed child care, so satisfying the demand for licensed care does not mean having spaces for 100% of children.

When considering child care use, it’s important to take other family or education programs into account.  For many families with very young children, parent-only care during maternity or parental leave is their choice.  For many children who are already in full-school-day kindergarten at four or five years of age, they do not need or their parents do not want supplementary child care. 

Across Canada:

  • 24% of children younger than two years of age  are in licensed child care.  In this age bracket, 62% are in parent-only care, with many of these parents on maternity or parental leave. 
  • 55% of all children in Canada who are two or  three years of age currently use licensed care. 
  • 68% of all four- and five-year-olds who are not yet in kindergarten currently use licensed care. 
  • But, when those four- and five-year-olds reach kindergarten, the use of licensed child care drops to 33%.
Percent of Canadian Children Using Licensed Child Care by Age Group and Kindergarten Attendance, 2023

From the Public User Microdata File of the Canadian Survey on Early Learning and Child Care, 2023.

Licensed Child Care and Low-Income Families

The other main claim in Cardus’ brief is that low-income families do not get much access to child care services when child care is universally funded. The implication is that low-income families would be better served by a targeted child care program.  And that universal $10 a day child care will mostly serve affluent families rather than those who have low-incomes.

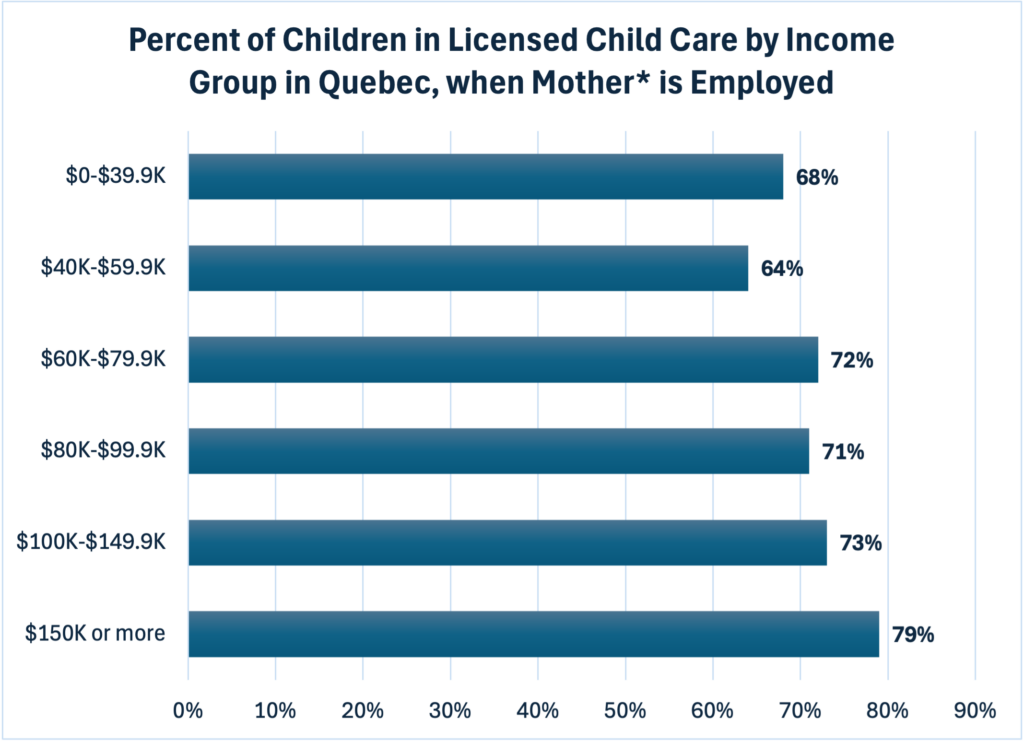
There are two problems with this.  First, the use of licensed child care by low-income families is already larger than you might imagine.  In Canada outside Quebec 36% of children with employed mothers from the lowest income group use licensed care.  And in Quebec, 68% of children with employed mothers from the lowest income group are in licensed child care.

 Second, Cardus has identified the wrong culprit for the important inequities that remain.  It is market-driven child care that disadvantages low-income families.  It is universal  child care that does a better job of welcoming the participation of low-income children to licensed child care. 

We can see this by comparing access to licensed child care for different income groups where the mother is employed in provinces outside Quebec to the same data from Quebec.  Two conclusions are obvious in the charts below.  First, in Quebec, a much greater percentage of children from these low-income families are able to access licensed child care than is the case in the rest of Canada’s provinces.  Second, the gap in access between the lowest and highest income groups is much smaller in Quebec than it is in the rest of Canada.  As before, this data is from Statistics Canada’s recent parent survey. 

What’s the explanation?  When child care fees were uncontrolled (as they were in Canada outside Quebec until 2021 or 2022) many families have found licensed child care to be completely unaffordable.  Most low-income families were squeezed out.  Targeted child care subsidies were not enough to reverse this trend.  Naturally, the majority of child care users were from more affluent families.  But this was a result of the mostly unrestricted operation of the free market in child care, not the result of a massive program to lower fees. 

Percent of Children in Licensed Child Care by Income Group in Canada outside Quebec when Mother is Employed

From the Public User Microdata File of the Canadian Survey on Early Learning and Child Care, 2023.

Note: * The vast majority of parents responding to the survey were mothers

Percent of Children in Licensed Child Care by Income Group in Quebec when Mother is Employed

From the Public User Microdata File of the Canadian Survey on Early Learning and Child Care, 2023.

Note: * The vast majority of parents responding to the survey were mothers

As Cardus would know if they had looked at the federal-provincial-territorial agreements that have brought us the $10 a day child care program, improved equity in access for children from different backgrounds is a key objective of the federal program.  There are substantial federal, provincial and territorial efforts to ensure that new child care capacity is directed towards underserved populations – low income children, vulnerable children, children from diverse communities, children with special needs, and Francophone and Indigenous children.  Still, there is too little access to licensed child care for low-income families – on this we agree with Cardus.  But eliminating funding support for child care services and instead paying money to families to stay at home is the opposite of a solution to this problem.

Cardus wants to make child care unaffordable again

Cardus does not really want financial support for licensed child care at all.  Instead, Cardus wants us to return to some version of Stephen Harper’s Universal Child Care Benefit.  They estimate that if the federal spending on the $10 a day child care program was divided equally amongst families instead of going directly to day care centres to lower fees, each family would receive $3,869 per child, per year.  But, right now, families using low fee child care are receiving $5,000 – $15,000 in child care fee reductions.  With the end of direct funding of child care, child care fees would soar and nearly a million families would be much worse off than they are currently. Child care would be unaffordable once again, and mothers would be squeezed out of employment by high fees.  How is that a sensible and affordable child care policy?  No wonder 75% of Canadians think that a Conservative government, if elected, shouldn’t end the $10 a day child care program.

There Is still a lot of work to do to build a $10 a day child care program for all the families that want to use it – especially in expanding the qualified workforce and the supply of services.  But already many Canadian children and families are much better off than they were in 2021.  The priority now is to finish the job of providing affordable, accessible, quality child

HALLELUJAH!  ONTARIO FINALLY HAS A NEW FUNDING FORMULA

Hallelujah!  As of August 14th, 2024, there finally is a funding formula to provide some revenue-certainty for child care providers in Ontario. Not a moment too soon, in fact, a year or two too late. As of January 2025, this formula for the provision of operational funding to providers will be implemented to replace the inequitable revenue-replacement model that has existed since April 2022. As the new funding guidelines admit “[w]hile a revenue replacement approach is transparent and simple to implement, it is not responsive to the true cost of providing child care in Ontario.” (p. 7).  Revenue replacement was not equitable and it did not facilitate growth of capacity, so we will not mourn its passing.

This marks a new stage of development of the $10 a day child care program in Ontario.  And, I am sure that other provinces will be looking closely at this example to see if they should model their funding formulas on this one.  Together, we need to assess whether the funding formula is any good and what its strengths and weaknesses are.  As with any funding formula, there are many details and understanding how the system will work is not easy.  This blog post is a start.  In this post, there is a lot of description and only a small amount of opinion.  More opinion will follow soon.

I think a question and answer format will be best.  And, I will, in this blog post, only describe funding for centres, not for home child care agencies.  I will get to family child care in a later post. 

  1. B2C2 and others have called for a funding formula similar to the one in Prince Edward Island; is Ontario’s new funding formula like PEI’s?

Ontario’s funding formula is not like PEI’s.  The allowed costs in PEI are based on the provincial wage grid for child care staff with wages varying by qualification level and experience.  PEI’s formula encourages hiring of staff with higher qualifications because operating funding is increased to cover actual wage costs.  Then, PEI has an allowance of 20% for benefits and there is a provincially-funded pension plan.  And PEI’s formula provides the same revenues across the Island for similar centres.

In contrast, Ontario does not have a wage grid for child care staff.  Ontario’s new funding formula gives flexibility to a centre to spend its allocation in different ways, but does not, in particular, reward the hiring of more staff who are fully qualified RECEs.  Ontario’s benchmark for benefits is only 13.4% for staff and 16.2% for Supervisors and there is no provincially-funded pension plan.  And operational funding for centres under the new funding formula in Ontario will be highly variable across different locations.

2. How is the Funding Formula structured?

The structure of the new Ontario child care funding formula is relatively simple, getting more complex as you get into the details.  The funding formula is based on calculation of what is called a “Benchmark Allocation”.  A Benchmark Allocation, as the Ministry of Education’s funding rules make clear, is supposed to represent “the typical costs of providing quality child care in a geographic region, based on planned operating spaces.”  (p. 9) . One of the Ministry’s goals with the new funding and accountability processes is “to gradually shift the overall cost of providing child care … towards more standardized costs, as represented by the benchmark allocations.” (p. 48).  On top of the Benchmark Allocation, there is also an allocation for profit or surplus.

Benchmark Allocations, which vary across the province, are designed so that about 50% of existing licensees will have their expected eligible costs fully covered.  The other 50% of licensees will not have their costs covered by the regular (benchmark) funding allocation, but legacy centres (those currently and continuously in CWELCC) with higher costs will be eligible for a Legacy Top-Up to this funding.  This top-up formula evaluates the 2023 cost structure of centres, along with 2025 evidence of some fixed costs such as rent, insurance and property tax. There is also a provision for cost increases since 2023.

Calculation of the Benchmark Allocation for a centre involves two parts:

  • Calculation of the Unadjusted Benchmark Allocation (total of four components)
  • This is multiplied by a Geographic Adjustment Factor (GAF) which can move the total up or down. 

Once adjusted in this way, our calculation is called the “Benchmark Allocation” for your centre. 

3. What About Top-Ups?

That’s not the end of it, though.  When the Ministry canvassed existing centres about their actual costs, they found lots of variation.  To account for this cost variation, the Ontario funding formula includes a Legacy Top-Up to provide additional revenue for legacy centres with costs higher than their Benchmark Allocation. 

In addition, there is another revenue top-up that applies only to new spaces or new centres.  This is called a Growth Top-Up and recognizes that the Benchmark Allocation will not necessarily be sufficient to cover operational funding of new capacity.  The Growth Top-Up will provide some increased operating revenues to most centres that are new or growing in capacity. 

Details on the Top-Ups

  • Legacy Top-Up – If you are a legacy centre (you were signed up to CWELCC when this funding formula was born and still are) and your proven costs (according to a formula) are higher than that Benchmark Allocation, your SSM will provide a Legacy Top-Up to cover these supplementary costs. 
  • Growth Top-Up – In the first year of any expansion, you will be eligible for a Growth Top-Up which recognizes the (higher than benchmark) program costs associated with new spaces that come on stream during the year.
  • In years after 2025, a centre that received either of these two top-ups will receive a “Rolling Top-Up” based on the calculated top-ups that were received in 2025.  In other words, these top-ups will become permanent in revenue calculations after 2025.

The “Program Cost Allocation” is the name the new funding system will use to describe the sum of your Benchmark Allocation plus any top-ups for which you are eligible

All of the above calculations are based on an annual operating plan for the coming year that each centre submits to its SSM.  Funding is determined based on the plans for each centre. 

Amongst other things, the operating plan will specify the planned number of operating service days for each age group and the planned number of operating spaces for each age group.  In order to calculate the amount of operating money the SSM will give you, the SSM must then subtract the amount of fee revenue (adjusted for enrollment shortfalls) you expect to receive from parents, or on behalf of parents who receive Child Care Subsidy.

It is important to note that funding is not aggregated across centres that have the same licence-holder, so that the funding allocation for a centre has to be spent on the costs of that specific centre.  This will, no doubt, cause problems for multi-site operations who are used to planning and funding activities across the group of centres, rather than treating each centre separately.

4. More details about Top-Ups

The funding guidelines describe Legacy Costs this way: “Legacy costs are costs that are consistent with legacy centres’/agencies’ 2023 cost structures, adjusted for eligibility, cost escalation, and changes to operating practices and fixed costs.”  Legacy Top-Ups are designed to ensure that Legacy Costs are covered going forward.  In applying for a legacy top-up, centres would provide an audited 2023 Statement of Operations and other financial information to their SSMs to calculate the cost of eligible services (e.g., for children 0-5 rather than 6-12) at the level of an individual licence.  From these costs, ongoing costs would be scaled up to reflect cost increases between 2023 and 2025.   This would allow the calculation of the amount by which Program Cost revenues need to be scaled up  to cover higher costs.  This is the Legacy Top-Up.  The Legacy Top-Up will take account of changes in spaces, days and hours of service over this period.

There is also a Growth Top-Up for all centres that are adding new spaces.  Before the calendar year begins, the annual revenues of each centre are determined by their SSM based on operational plans filed with the SSM.  For centres that expand licensed capacity during the year, an adjustment needs to be made.  This is the Growth Top-Up.  The calculation of revenues for these new spaces is largely similar to the calculation of the Benchmark Allocation, but applied only to the new spaces and with the allocation raised by a Growth Multiplier.  Importantly, there is no Legacy Top-Up on new spaces, even if other centres operated by the same licensee receive Legacy Top-Ups because of elevated costs.   The new Benchmark Allocation is multiplied by a Growth Multiplier.  This Growth Multiplier may add as little as 0% to the funding for these new space (City of Cornwall) or as much as 30% (County of Lanark, United Counties of Prescott and Russell, County of Renfrew, Rainy River DSSAB), based on geography. The typical value of the Growth Multipliers is about 15%.

Once these top-ups are added to the Benchmark Allocation for an eligible centre, the total is called the Program Cost Allocation.

5. What about Profit or Surplus?

The new Ontario funding formula has one more major component.  It builds in a separate allocation which goes as profit for owners or as surplus for non-profit or public child care centres.  Profit/surplus therefore does not depend on good performance, but is a guaranteed payment.  On the other hand, the formula provides a limitation on the amount of profit that can be earned in any year out of the government portion of revenues.

There are three parts to the calculation of profit/surplus (which the Ministry guidelines call “allocation in lieu of profit/surplus”).  There is a base amount, a part that is 3.5% times the amount of the Benchmark Allocation and a part that is 4.25% times the Program Cost Allocation (which is the sum of the Benchmark Allocation and the top-ups).  These three parts are added together to get the total Profit/Surplus allocation.  Both the Benchmark Allocation and the Program Cost Allocation are influenced by the Geographic Adjustment Factor.  That means that the amount of Profit/Surplus is also affected by this GAF.

6. How are the individual parts calculated that make up the Benchmark Allocation?

There are four components that are summed together to get the Unadjusted Benchmark Allocation: the Program Staffing Component (related to the wages and benefits of program staff), the Supervisor Component (related to the wages and benefits of the Supervisor), the Accommodation Component, and the Operations Component (related to all other costs, including wages and benefits of non-program staff).  These are calculated based on the number of licensed spaces for different age groups, the operating capacity this year for different age groups, the proportion of staff in your centre that are delivering CWELCC-eligible services, the number of service-days of child care you provide to each age group over the year and a few other things.  All of these calculations are based on your plans for your child care program in the coming year, not on past numbers.

In effect, each of the four components is adjusted according to a Geographic Adjustment Factor, although this calculation is  done at the end after the four components are summed together.  In other words, if you are in what the Ministry’s data says is a high cost area, the amounts for each element of this allocation will be boosted.  If you are in what the Ministry’s data says is a lower cost area, the amounts for each element of the allocation will be lowered. 

For example, centres in Toronto have a Geographic Adjustment Factor of 1.07; centres in Kingston have a Geographic Adjustment Factor of 0.79.  So, the benchmark revenue allocation in a Toronto centre will be boosted by 7%.  The benchmark revenue allocation in Kingston will be reduced by 21%.  These Geographic Adjustment Factors are said to represent differences in the costs of providing child care services in different parts of the province.

7. Can you provide a  simple example of how the Benchmark Allocation is calculated?

(There are some helpful worked-out examples from page 55 onwards in Schedule D of the Funding Guidelines.  But, the example below provides some additional words of explanation).

As an example, think of a child care centre in a community setting in Toronto that has 48 preschoolers and no other children, just to make calculations simple.  We will assume that the licensed capacity and actual operating capacity of the centre is 48 children.  The per-diem benchmark allowed in the funding formula for 2025 for preschoolers (full day child care for children over 2.5 years) is $39.23.  Assume the centre will be in operation 261 days per year.

To get the amount of the Program Staffing component, we multiply 48 preschoolers X 261 service-days per year X a per-diem of $39.23. X an ancillary costs multiplier (13.4% to cover mandatory benefits like CPP/EI/EHT/WSIB).  In the case of our example, that gives us an amount of $557,330.88. 

To get the Supervisor component of the Program Costs, we multiply 261 service-days per year X a Supervisor per-diem of $301.38 X a Supervisor ancillary costs multiplier (16.2% to cover mandatory benefits).  That gives us a total of $91,403.13.

The allowance for Accommodation costs is based on the number of licensed spaces, independent of current operating capacity.  In our example, there are 48 licensed spaces.  The annual per-space benchmark varies according to the age category of these licensed spaces, but also by whether the centre is in a community setting or is located in a public school.  For preschool spaces in a community setting, the benchmark is $1,735.54 per space.  For this centre, the Accommodation costs component would be 48 X $1,735.54 = $83,305.92.

The Operations Costs component has both a fixed and a variable part to the calculations, and varies according to whether the centre is in a community setting or a public school. The fixed part is based on the number of licensed spaces and the annual number of days of service and this varies by age category of children.  The variable part is based on the planned operating capacity and the number of days of service and this also varies by age category of children.  The community-setting benchmark for fixed operations costs for preschoolers is $15.09 per licensed space-day.  The community-setting benchmark for variable operations costs for preschoolers is $1.64 per operating space-day.  So, for our example, the fixed part of operations costs would be 48 X 261 X $15.09 = $189,047.52.  The variable part of operations costs would be 48 X 261 X $1.64 = $20,545.92.  The total allocation for operations costs would be $209,593.44.

If we sum the allocations for the four components in our example, we get $557,330.88 + $91,403.13 + $83,305.92 + $209,593.44 = $941,633.37.  This is the Unadjusted Benchmark Allocation.

This calculation would be the same for any centre with 48 preschoolers anywhere in the province.  However, the Geographic Adjustment Factor (GAF) will change this allocation in every location.  Toronto has a Geographic Adjustment Factor of 1.07 (i.e., relatively high typical costs) so multiply the Program Costs number by 1.07 to get $1,007,547.71.  With the GAF applied this is called the “Benchmark Allocation”.  To see the importance of this Geographic Adjustment Factor: if this same centre was in Kingston, the Benchmark Allocation would be $743,890.36.

It is important to note that this allocation can be spent in any way the centre thinks best to provide services for children.  It can pay lower or higher wages,  more or less in benefits, more or less to the Supervisor, more or less in mortgage or rental costs, more or less in the costs of operations, as long as these expenditures are judged to be eligible expenditures.  The flexibility in spending is potentially positive, but without a wage grid (there is only a wage floor for RECEs), it means that unscrupulous operators could cut corners on compensation and quality in order to spend money in other ways.  That would be undesirable, of course.

8. What about the calculation of profit/surplus for this centre?

The base amount of profit/surplus is $6,000 annually.  For our example centre of 48 preschoolers in Toronto, the part based on the Benchmark Allocation would be 0.035 X $1,007,547.71 = $35,264.17.  Because we are assuming no Legacy or Growth Top-Ups for this centre, the Program Cost Allocation is the same as the Benchmark Allocation.  Therefore, the part of profit/surplus based on the Program Cost Allocation is 0.0425 X $1,007,547.71= $42,820.78.  The sum of these three parts is the allocation in lieu of  Profit/Surplus, which is $84,084.95.

The total revenue of this centre during the year would be the Benchmark Allocation of $1,007,547.71 plus the Profit/Surplus allocation of $84,084.95, which equals $1,091,632.66.  Profit/Surplus would be 7.7% of total revenue.  Another way of thinking of it: profit in this example is a markup of 8.3% over the Benchmark Cost Allocation.

Not all of this revenue would come from the SSMs of course.  The planned amount to be received from parents or on behalf of parents (adjusted for enrollment) would be subtracted from this total revenue calculation to get the annual funds received from the SSM.

9. Does the new funding formula provide enough funding?

This, of course, is the big question.  I need you to help me answer this.  I have some examples in the table below and they give calculations of the total amount of revenue centres will have, based on their size and location in the province.  The examples are simple and do not include provision of before-and-after school care for kindergarten children.  There are three centre sizes:

  • 49 children: 10 infants, 15 toddlers, 24 preschoolers
  • 73 children: 10 infants, 15 toddlers, 48 preschoolers
  • 88 children: 10 infants, 30 toddlers, 48 preschoolers

These centres are located in Toronto, Ottawa and Windsor.  Toronto has a Geographic Adjustment Factor (GAF) of 1.07.  Ottawa has a GAF of 0.94.  Windsor has a GAF of 0.80. These Geographic Adjustment Factors play a big role in the revenue totals that centres will receive and these examples are a good indication of the range of revenue values that will affect centres across Ontario, urban and rural, north and south.   The other factor that affects funding is whether the centre is located in a community or in a publicly-funded school.  This affects funding allocations for Accommodation and for Operations.

This table calculates the total annual revenue of these centres. Total revenue includes both the amount to cover costs and the amount to cover profit or surplus.  Some of total revenue will come in funding from the SSM and some will come from parent revenue (or child care subsidy revenues provided on behalf of parents).  As parent fees go down, a greater percentage of revenues will come from government and a smaller percentage from parents, but the total revenue would remain the same (unless benchmarks are changed).


Table 1: Total Annual Revenues of Centres of Different Sizes and Locations

Under Ontario’s New Funding Formula – Community-Based and School-Based Centres

Toronto Ottawa Windsor
Community-based or School-based centreCommunityCommunityCommunity
Geographic Adjustment Factor - GAF1.070.940.8
Total Revenue – 49 space centre$1.394m$1.226m$1.044m
Total Revenue – 73 space centre $1.884m$1.656m$1.410m
Total Revenue – 88 space centre$2.283m$2.006m$1.709m
TorontoOttawa Windsor
Community-based or School-based centreSchoolSchoolSchool
Geographic Adjustment Factor - GAF1.070.940.8
Total Revenue – 49 space centre$1.291m$1.135m$0.967m
Total Revenue – 73 space centre $1.731m$1.522m$1.296m
Total Revenue – 88 space centre$2.098m$1.844m$1.570m

Notes:

  • Total Revenue figures in the table are in millions of dollars of revenue annually, including both operating funding from governments and parent fees.
  • 49 space centre has 10 infants, 15 toddlers, 24 preschoolers, all full-day
  • 73 space centre has 10 infants, 15 toddlers, 48 preschoolers, all full-day
  • 88 space centre has 10 infants, 30 toddlers, 48 preschoolers, all full-day

Notice that for the same sized centre, a location in Toronto will get revenues which are hundreds of thousands of dollars higher than a location in Windsor (or many other places across the province).  Are true underlying costs that different in different locations? 

And, are these amounts of total revenue enough to operate centres and provide good quality child care?  I don’t have enough evidence yet to draw a conclusion, but I’m happy to hear from centre directors about your example and experience.

These calculations are based on Ontario’s 2025 benchmarks.  Benchmarks can change in future years.  Current centres will be potentially eligible for Legacy Top-Ups.  And, allocations for new centres will be affected by Growth Multipliers (but not Legacy Top-Ups).

10. What is the role of the SSMs?

The SSMs have many roles in relation to planning and operationalizing growth plans and assisting and communicating with child care providers in a range of different ways.

If we focus specifically on their role in relation to funding in 2025, the SSMs have to:

  • Receive operational plans from each operator/each centre.  Operating plans will include planned operating spaces for each age group, planned number of service days for each age group, number of hours of service for each age group, copy of parent handbook. 
  • Collect legacy data from those operators claiming a Legacy Top-Up.  Legacy data in 2025 will include specific evidence of any fixed costs (especially accommodation costs), the operating budget for 2025, 2023 audited financial statements and any related financial reports to support claim.
  • Calculate the Program Cost Allocations for each centre including the Legacy Top-Ups, the Growth Top-Ups and the Profit/Surplus for each centre.
  • Schedule advance payments for each centre based on these calculated Allocations
  • Select centres that will have their reported costs reviewed in a cost review (not the same as the Direct Engagements on Compliance) and carry out cost reviews
  • Accept and process applications for in-year changes in funding
  • Collect spending attestations and standardized financial reports from each centre
  • Compare Allocations to Actual Costs/Spending and promptly recover overpayments to centres and refund these to Ministry.

11. What are the key issues with this new funding formula?

The biggest issue with the funding formula is one that is not yet answered.  In new centres and new spaces, will there be enough funding available for providers to fund the provision of good quality care with educators and other staff that are fairly and reasonably compensated?

The Legacy Top-Ups in the funding formula are designed to ensure that existing centres with costs that are higher than the median will not have to close their doors; their costs will apparently be compensated by revenue supplements that become permanent through Rolling Top-Ups.  That’s obviously a good thing, but Legacy Top-Ups are not available to new centres or even to new spaces in existing centres. 

So, in judging the adequacy of revenues provided by this funding formula going forward, we need to ignore Legacy Top-Ups.  They exist for Legacy centres (i.e., current centres), but not for new centres.  The real question is “for new spaces (growth), will the revenues be adequate to provide good child care?”.   At this point, we don’t have a clear answer.  What we do know is that new spaces will only be eligible for the Benchmark Allocation  plus the Growth Top-Up plus the Allocation in Lieu of Profit/Surplus. 

As for the rest of the key issues with this new funding formula, that’s a topic for another blog.  Coming soon.

Affordable Child Care Services vs Money for Parents

Those who oppose the $10 a day program often argue that there is a simple and better program to replace it – give money directly to parents instead.  The logic is, at first glance, persuasive.  If you give parents money, it seems like they should be able to purchase exactly the child care they need.  And competition among different providers should, you might think, keep fees down.  Programs that directly fund child care services, like the $10 a day program, are said to be bureaucratic and inflexible and to create huge shortages and long waiting lists. 

There is some truth here, but much falsehood, and much deliberate ignoring of the evidence on the impact of a “family allowance” approach.  I have just written a report for The Prosperity Project that examines the likely impacts of giving parents money instead of funding and providing child care services that parents can use.  I unearth a lot of new data about families that are using child care in Canada and the number of parents who want access to affordable, accessible, high quality child care. 

The evidence shows that this type of “family allowance” fails as public policy because it:

(a) isn’t what most families want

(b) doesn’t address families’ needs for child care

(c) would be much more expensive than the $10 a day program

(d) would have negative effects on women’s employment and the economy, and would increase the gender-based child penalty that mothers pay with reduced earnings

(e) has been tried before and hasn’t solved child care issues, and

(f) ignores the very large child benefit programs that already provide money to parents.

You should read the report in full (19 pages), or at least its Executive Summary (3 pages).  Below, I provide a few tidbits to encourage you to dig deeper.

  • As of 2023, when Statistics Canada collected large amounts of data from parents about child care and employment, there are 938,000 Canadian children using licensed or accredited child care services – the kind of services supported by the federal government program.  In fact, over three-quarters of children using any kind of child care are in licensed care.   In 8 of Canada’s 13 jurisdictions, average fees for this child care is down to $10 a day or less.  Other jurisdictions have lowered fees by at least half relative to fee levels in 2019-20.  In other words, although the press scarcely covers it, a very large number of Canadian children and families are already benefiting from licensed child care that is subsidized to be affordable and more accessible.
    • Licensed child care is not the only part of the set of services and benefits that will make up a fully developed early learning and child care system.  Many children benefit from full-day or part-day kindergarten at ages 4 and 5 years.  Many children and families benefit from paid maternity and parental leave for up to 12 or even 18 months.  If we put these all together, it is already true that in 2023 over 1.5 million children currently benefit from Canada’s early learning and child care and leave arrangements.  That is about 2/3rds of all children 0-5 years of age.  
    • Some people think that the reason some parents don’t currently use child care is because they don’t want to.  But, outside Quebec, most families (58%) that currently do not use any child care would like to use some type of non-parental child care if they can find what they need and want.  And, of these, the lion’s share – 62% – would like to use licensed child care, largely as a means to join or rejoin the workforce. 
    • Some people argue that it is mostly affluent parents that benefit from universal child care programs and that marginalized families and those from diverse backgrounds are left behind.  That is certainly true of market-based child care systems when fees are not controlled; high parent fees are only affordable by affluent families and many vulnerable families do not qualify for income-based subsidies.  However in fixed-fee systems like the $10 a day program, families from all backgrounds gain access.  I show a series of charts from Quebec making this point.
    • A family allowance program would have to give parents an amount of money that was equivalent, on average, to what they gain by having $10 a day child care.  This family allowance program would cost the federal government just over $28.5 billion annually and its net cost would be three times as much as the cost of providing child care services.  
    • Women who have children suffer substantial losses in earnings after the birth of a child.  Economists have found that mothers’ earnings decrease by 49% in the year of a child’s birth.  Even ten years later, women suffer from an average earnings loss of 34% relative to their earnings before childbirth. Universal child care has been found to substantially reduce these “child penalties”.  In other words, accessible child care services make an important contribution to increasing gender equity.

    Please read the full report and executive summary

    Ontario Is Violating the Early Learning and Child Care Agreement

    Most child care in Ontario is provided by non-profit or public operators.  This has been true for years.  A full 70% of the licensed/regulated child care spaces for children 0-5 were non-profit or public back in 2022, when Ontario signed the Canada-Wide Agreement with Ottawa. 

    So, two things are not in doubt.  First, it is obviously possible for non-profit and public child care services in Ontario to grow and expand, given the right conditions.  They have done it successfully in the past, more successfully than the for-profit child care operators.  Second, the Ontario government, with the support of municipal governments and school boards, knows exactly how to facilitate and co-ordinate the expansion of non-profit and public child care, because it has done this in the past.

    So, if non-profit and public child care are not expanding rapidly in Ontario, it must have to do with the failures of Ontario government policy (as described in my recent blog post). 

    • Ontario has failed to fix shortages of early childhood educators.  Starting wages in Ontario are $5.00 an hour less than in P.E.I.!
    • It has failed to provide or enable sources of capital funding for expansion of community non-profit child care. 
    • It has starved child care providers of revenue in the $10 a day program and has failed to provide any certainty about future revenue streams for operators.
    • Ontario has failed so comprehensively that you have to wonder if the failings are deliberate. 

    To cap it all off, we now find that Ontario is deliberately violating the terms of the Canada-Wide Agreement that it signed with the federal government back in March 2022.   Ontario promised to increase child care capacity by at least 86,000 spaces, and it promised that a maximum of 30% of these new spaces would be operated by commercial for-profit operators.  The balance would be community-based or school-based non-profit and public child care.  It also promised that it would prioritize development of child care in underserved areas and amongst families with greater needs. 

    Instead, about 75% of the expansion that has occurred has been in for-profit spaces.  And at least half of the new spaces are in areas of greater profitability rather than areas of greater need.  Half of the new spaces can charge whatever fees they want, rather than being affordable spaces. 

    We know some details about Ontario’s expansion because of good journalism by Allison Jones of Canadian Press.  She has recently written:

    “Ontario’s deal committed the province to 86,000 new child–care spaces since 2019, though the deal was signed in 2022. But so far while there have been about 51,000 new spaces since 2019 for the kids five and under, the age group covered by the national program, only 25,500 of those are within the $10-a-day system.”

    So, let’s do the math:

    • Pretty well all of the new spaces that are outside the $10 a day system (without any controls on fees) are for-profit, so that is already half of the 51,000 spaces. 
    • Much of the growth inside the $10 a day system is also for-profit.  When Ontario published its Action Plan in 2022 it told us that 15,000 spaces had  opened since 2019 and 45% of this was for-profit. 
    • A further 21,200 spaces were said to be “in the pipeline” and 66% of this was for-profit. 
    • I estimate therefore that about half of the growth since 2019 that is inside the $10 a day system is for-profit (the Ministry of Education has these figures and is shy about releasing them, which tells you that they know they have something to hide). 
    • In other words, about 75% of the total of 51,000 new spaces in Ontario since 2019 are in the for-profit sector.

    This is a clear violation of the Canada-Wide Agreement Ontario signed in 2022.  In that agreement it promised that “at the end of this Agreement, the proportion of not-for-profit licensed child care spaces for children age 0 to 5 compared to the total number of licensed child care spaces for children age 0 to 5 will be 70% or higher.” (emphasis added).  The agreement clarifies the purpose of this clause: “to ensure that the existing proportion of not-for-profit licensed child care spaces for children age 0 to 5 will be maintained or increased by the end of this Agreement.”

    In case there was any doubt, the “definitions” section of the agreement refers to the Child Care and Early Years Act, 2014 in defining licensed child care.  In other words, it refers to all licensed child care governed by that act.  

    So, Ontario is taking federal money intended to build a publicly-managed, affordable and accessible high quality child care system and it is not doing what is necessary to provide spaces for children and families.

    Of course, parents who are desperate for child care spaces right now don’t care if the spaces are for-profit, non-profit or public.  They  just want a space for their child and they want it now.  The negative effects of relying on for-profit child care without sufficient controls won’t show up for a while. 

    That’s what happened in the early 2000s when the Government of Quebec, under Jean Charest, tried the same trick – relying on for-profit child care for expansion.  The results were disastrous for the quality of child care services, with nearly half of the new for-profit centres failing quality assessments sponsored by the Quebec Government.  Similar quality problems are what led  Mathieu Lacombe, the Quebec Minister of Families from 2018 to 2022 to say that allowing for the expansion of private daycare, was the ‘biggest mistake the Quebec government committed in the last 25 years.”  

    As I wrote in that recent blog:

     I am not trying to say that all for-profit operators provide poor quality child care or that all of them skimp on child care staffing.  Some small for-profit operators provide good quality care and devote themselves to quality improvements.  You can have a certain percentage of for-profit providers in a publicly-funded child care system, but there need to be strong measures of public management that limit the ability of for-profit enterprises to extract profit at the expense of quality. 

    That was the spirit of the Agreement that Ontario signed up to  in 2022.  If Ontario were to implement this agreement in good faith, it would adopt a generous funding formula to cover actual costs, it would make expansion of child care into an all-of-government priority with a range of provisions for capital financing, it would develop a wage grid for child care educators that is at least as generous as the one in PEI and it would implement the agreement it signed on the balance of non-profit and for-profit expansion.  Ontario’s parents and children need the $10 a day child care system they were promised.