
New Zealand’s Funding System for Early Childhood Education and Care Services

New Zealand has a substantial amount of supply-side funding (i.e., direct funding of operating costs) of its various types of early childhood education and care services.  In that way, it’s quite different from Australia; in Australia, the large majority of funding is on the demand-side – a payment to services on behalf of parents (and varying in amount according to the circumstances of the parents) when they use certain types of regulated child care.

In Canada, we’re very interested in looking at different examples of supply-side funding.  Of course, child care providers in different circumstances have different costs.  An effective supply-side funding system needs to account for legitimate differences in the costs of service delivery and pay different funding rates to providers in different circumstances.

Amongst English-speaking countries, New Zealand was early in funding its child care services on the supply side and stuck with it.  For that reason, and for its pioneering curriculum Te Whāriki, and for its articulate advocates, many of us regarded New Zealand as a model to follow.  Some aspects of its funding model are interesting to examine, but its early education and care system has not fared well over the years.  New Zealand had a supply-side funding system for child care, but it did not impose any limits on child care fees that could be charged.  It turns out that was a huge mistake. 

New Zealand now has child care that is amongst the least affordable in the OECD, despite supply-side funding and despite offering 20 hours of “free” early childhood education to children 3, 4 and 5 years of age (essentially to children aged 3 and 4 because schooling starts on a child’s 5th birthday in New Zealand).  The average parent fee in New Zealand for children 0-5 was calculated to be $6.89 per hour or over $60 per day if, for example, using child care for a 9-hour day.

I’m not going to try to unpack what has gone wrong with New Zealand’s education and care system in this blogpost.  Instead, I want to look at some of the details of their supply-side funding system to see what we in Canada can learn from it.  The point of what I wrote above is to remind you that while a supply-side funding system is desirable, it is not sufficient.  There need to be controls on the fees that services can charge to parents as well and there need to be strong measures of financial accountability.

There are a range of different early education and child care services that are funded in New Zealand.  There are education and care services (child care centres), kindergartens (also in centres but governed by a kindergarten association), hospital-based services and home-based services.  All of these are part of what are called teacher-led services.  Then there are parent-led services that also receive funding.  This blogpost will focus on education and care services in child care centres; kindergartens are funded quite similarly. 

Half of New Zealand’s approximately 4,700 early childhood education services are education and care services and nearly 70% of these are now for-profit enterprises (up from about 40% three decades ago).  There are nearly 700 kindergartens – all of these are community-based not-for-profit organizations.

There are many factors that will affect the amount of supply-side funding a centre gets.  To summarize, these are the main ones:

  • The type of service (education and care service vs. kindergarten etc.);
  • Whether the services are full-day or are part-day and perhaps part-year;
  • The proportion of staff hours that are covered by certificated teachers (i.e., with ECE or primary teaching qualification plus a current practising certificate).  These must be staff hours that are required to fulfill ratio requirements;
  • The pay level relative to union-bargained kindergarten and primary teacher pay levels (i.e., supplementary funding if all teachers are paid at certain rates);
  • The age of children attending the service (under 2, 2 and over);
  • Whether the service offers parents the program for 20 hours per week of free child care for children aged 3, 4 and 5;
  • Whether the children attending a centre come from low socio-economic communities;
  • Whether the children attending a centre come from communities with a substantial population with special needs and from non-English-speaking backgrounds;
  • Whether a centre provides the majority of its service in a language and culture other than English;
  • Whether a centre is isolated from population centres;
  • Whether 20% or more of the children attending a service are considered to be disadvantaged (dependent of person on social assistance or other programs).

The largest portion of this regular funding for most centres would be related to the first six of these factors.  These funding variations are covered by the Early Childhood Education Funding Subsidy and 20 Hours Early Childhood Education.  The remaining funding variations are covered by Equity Funding, the Annual Top-Up for Isolated Services and Targeted Funding for Disadvantage.  Details are available here.  Of course, there are regular detailed reporting requirements for early childhood services (on enrollment, attendance, staff hours worked by teachers with different qualifications, pay levels, etc.) so that eligibility for funding can be calculated.

For reference, here is the base funding rate table from January 1, 2023.  The figures in the table refer to the amount of funding per hour for each funded child hour.  Funded child hours are limited to no more than 6 hours in a day and no more than 30 hours in a week.  A centre may offer the 20 free hours of ECE program for 3, 4 and 5 year old children.  For those hours, the 20 Hours column would apply for the first 20 hours and other columns would apply for the remainder of hours up to 30 in a week (but no more than 6 in any day).  Funding under the 20 Hours ECE program is intended to cover full average costs, whereas other funding is intended to make a contribution to costs, but not cover full costs.

Base Funding Rates Per Hour for Education and Care Centres in New Zealand, 2020. 

Rates vary by percent of hours provided by certificated educators

Percent of required ratio hours that are delivered by certificated educators (either ECEs or primary teacher qualification)Funding per hour per child for children less than 2 years oldFunding per hour per child for children 2 or more years of ageFunding per hour per child under the 20 Hours ECE program for children 3, 4 or 5 years of age
100% certificated$14.16$8.30$13.55
80%-99%$13.56$7.50$12.79
50%-79%$12.28$6.47$11.65
25%-49%$9.91$5.16$10.24
0%-24%$8.48$4.28$9.33

Note that these are the base funding rates.  Centres that pay higher rates of pay to all of their teachers would receive higher funding rates – either the Parity Funding Rates or the Extended Parity Funding Rates.  These Parity funding rates are designed to encourage centres to pay wages that are fully competitive with union-bargained wages paid to primary teachers.

On top of this supply-side funding, there is also some targeted demand-side funding paid directly to the ECE service.  All the supply-side funding is provided through the Ministry of Education.  Childcare Subsidy is administered through Work and Income, Ministry of Social Development. 

What are the take-home messages for us in Canada?  First, supply-side funding systems are complex because there are a number of key sources of cost variations for child care services.  We need to do our homework in creating new funding systems.  Second, it is important to account for cost variations due to factors that may affect quality, such as ECE teacher qualifications and pay levels.  Third, supply-side funding is part of a new funding system; controls on fees charged to parents and strong measures of financial accountability are equally necessary.
Cost Controls and Supply-Side Funding: What Does Quebec Do?

As provinces and territories move towards $10 a day child care, they have committed themselves to creating new funding systems that implement cost controls on child care operators.  You’re probably wondering what the heck that means.

Well, child care in Canada outside Quebec is being transformed from being funded mostly by parent fees to being funded mostly by direct funding from the government to child care operators.  In return for the provision of specific services, child care operators get operating funding, often known as supply-side funding.   These child care operators also commit to lowering their parent fees, eventually down to an average of $10 a day. 

$10 a day is a small fraction of the total true cost of providing child care services, which means that  80%-90% of the funding will have to come from governments.  But when governments are providing the lion’s share of the money, they need to know that the funds are being spent efficiently to deliver services and not being wasted or disappearing into corporate profits.  So, the federal government has insisted that provincial and territorial governments develop new funding systems that ensure that operators are only paid for service delivery costs that are reasonable and not excessive.

Designing a new funding system that controls costs while also promoting quality is not necessarily easy.  After all, what is a reasonable cost and what is an unreasonable cost?  Figuring this out requires a detailed knowledge of the variations in costs across providers in the licensed child care sector.  And some difficult judgements.

Funding arrangements can be a bit boring and technical so most people ignore them and just complain about the results.  But it is worth the investment of a bit of time to figure out some of the issues.

One approach is to look at what other jurisdictions do – the ones that already have very substantial supply-side funding and controlled fees.  Quebec is one of those jurisdictions. 

A large portion of Quebec’s licensed child care is available at a fixed parent fee – currently $8.85 per day.  Many of these fixed-fee services are in not-for-profit Early Childhood Centres or CPEs (Centres de la Petite Enfance).   Fixed-fee services are also found in for-profit garderies; others are in family child care homes.

Below, I describe how CPEs are funded currently for fiscal year 2022-23.  Here’s the document (in French) that describes most of this.

Quebec’s funding model seeks to cover the legitimate costs that an operator has in the delivery of services to children.  There is a base allocation of funding and then supplementary allocations; the largest share of funding is the base allocation.  To be eligible for the base allocation, the service must be closed fewer than or equal to 13 days per year and must pay all of its personnel for every day. 

The base funding allocation is composed of five elements: direct services, auxiliary services, administrative services, occupancy costs and service level optimization. 

Direct services – This refers to the care provided for children of different ages and there is a rate of funding per day based on the enrollment in each age category.  $66.49 is paid for each infant day, $41.85 for each day for a child 18-47 months of age, and $33.64 is paid for each day for a child 48-59 months of age.  These amounts are adjusted regularly to take into account changes in the bargained wage scales for CPE employees.

These amounts are intended to cover the general operating costs of care provided to children, in particular the remuneration of qualified child care staff, assistants and specialized educators, training and professional development, and educational and recreational materials.

There are adjustments to these daily rates based on a couple of things.  First, if the overall compensation bill in this centre is particularly high (because, for instance, many of the staff have many years of experience), the daily amount will be adjusted up.  The reference rate is currently $26.62.  The daily rates could also be decreased if the compensation bill in the centre is low relative to the reference rate.

Another adjustment is based on qualifications of staff in the centre relative to a reference rate.  This provides some incentive to hire more qualified staff.  There is another adjustment for the attendance rate of enrolled children in the centre.  There is another adjustment for the number of paid days off provided to employees.

Auxiliary Services – these are services (and corresponding costs) related to food preparation, cleaning, snow removal, purchases of minor equipment, etc.   To cover this, there is an allocation of $8.09 per enrolled child per day, with a supplement for small centres.

Administrative Services – to cover the administrative costs of the centre, there is an allocation of $2,217.10 per licensed space for the first 60 spaces and $1,958.85 for each space above 60. 

Occupancy Costs – There is a part A and a part B to this calculation.  Part A allocates $552.16 for each space.  Part B, which is for leased space, varies by region and reaches its maximum at $1,823 per space in Montreal.  The centre can get the sum of these allocations if its actual occupancy expenses are at least equal to this total.

The occupancy cost allocation is intended to cover rental payments, energy costs, fire and theft insurance, maintenance and repair costs, and property taxes paid by the tenant.

Service Optimization – Enrollment has to be at least 90% and attendance has to be at least 70% or else the funding allocation is reduced.

There are clear instructions in the funding guidelines about exactly how to calculate important parameters of this funding formula.  For instance, it may be necessary to calculate the number of licensed spaces according to a formula if the number of spaces has changed over the course of the year.  There are instructions on how to calculate the annual enrollment, the rate of annual enrollment, the annual rate of attendance and the number of weighted days of enrollment (weighted by child/staff ratios). 

All of the above relates to the base allocation of operational funding.  There are also supplementary allocations:

  • One covers Employment Insurance costs for the employer. 
  • Another covers the Quebec Pension Plan costs for the employer. 
  • There is a supplementary allocation to cover the missing parent fees for parents who, because of low income or other factors, do not have to pay the $8.85 per day parent fee.
  • There is supplementary funding for spaces that are reserved for children referred to the centre by integrated health and social services centres or integrated university health and social services centres (CISSS/CIUSS)
  • There is a supplementary allocation for centres that have more than 8% of their enrolled hours provided to children who come from disadvantaged environments (to cover extra costs)
  • There is a supplementary allocation for children of school age in the centre from April to August.
  • There is supplementary funding for the care of children who have disabilities.
  • There is a supplementary allocation for the proportion of enrollment that is for non-standard hours.
  • There is a supplementary allocation for enrollment for part-time child care.
  • There is a supplementary allocation for small centres that have fewer than 32 spaces.
  • There is a supplementary allocation to allow a bonus payment to cooks that have reached the maximum of the salary scale.
  • There is also an allocation for small investments and infrastructure (less than $50,000) for which the operator has to apply.

So, what should we in the rest of Canada conclude about the design of new funding systems?

First, in theory such a funding system is simple.  It is a payment schedule for services delivered by the centre, based on the legitimate costs of this service delivery.  In practice, this kind of funding system is complicated and you need a lot of data on legitimate cost variations to design a fair and workable system.  That’s why I have been recommending that centres annually provide detailed expenditure data to governments as a basis for calculating and adjusting funding rules.

Second, and perhaps not obvious, this funding system is a lot easier to design if staff in all centres are paid according to a uniform wage grid for base wages because it is then easier to project the average cost of child care services per space. See also this.

Third, if you read the full document it is obvious that these funding rules have to be updated every year to account for changed costs and changed institutional arrangements.  

Comparing Then and Now: Child Care and Child and Family Benefits

Here’s a quick summary of some key conclusions from my new study published by IRPP today – Early Learning and Child Care in Canada: Where Have We Come From, Where Are We Going?

IN ENGLISH:  https://irpp.org/research-studies/early-learning-and-child-care-in-canada/ 

IN FRENCH: https://irpp.org/fr/research-studies/apprentissage-et-garde-des-jeunes-enfants-au-canada/

FactorProgressDescription
Child care spacesPositiveThere were a lot more licensed child care spaces in 2019 than there were in 1986 — 7 times as many — serving a fairly stable number of children.
Children in centre carePositiveThe popularity and acceptance of licensed centre-based child care has increased dramatically. Back in the early 1980s, only about 10% of preschool children of employed mothers used centre care, 40% were in informal paid care and about 50% were cared for by family members. In 2019, about half of preschool children of employed parents were in centre care, 20% in paid family child care and 30% cared for by family members.
Full-day kindergartenPositiveKindergarten in public schools has moved from mostly half-days during the school year for 5-year-olds to being widely available for full schooldays to 4- and 5-year-olds.
Mothers in the workforcePositiveLabour force participation of mothers has increased substantially since 1986. For instance, in 1986 the labour force participation rate for mothers with the youngest child 3 to 5 years of age was 62%. Now, it is 78%. This is still below rates in Quebec or for mothers with older children.
Child care feesNegativeChild care fees have risen substantially over the period from the mid-1980s. In fact, using preschool fees as the marker and adjusting for inflation, typical child care centre fees are over $3,000 more expensive in Ontario, Alberta and Nova Scotia, and more than $2,000 more expensive in British Columbia and New Brunswick. Quebec and Manitoba have been notable exceptions.
Staff-child ratiosMixedIn most provinces and territories, legislated staff-child ratios for centre care have not changed very much since 1986. Quebec’s staff-child ratios for children younger than 3 years are the worst across jurisdictions. The only province or territory to have gotten pretty consistently worse in staff-child ratios from 1986 to 2019 is Alberta.
Funding for low-income familiesMixedFunding of child care services across Canada has changed dramatically over the years. Back in 1986, the main federal funding instrument was the Canada Assistance Plan, which funded child care subsidies. All provinces and territories had child care subsidy payment systems targeting lower-income families and children. More than half of all child care funding came in the form of subsidies — often much more than half. Nowadays, Quebec no longer has a child care subsidy program of this type. In other provinces and territories, child care subsidies now comprise about 40% of total funding. However, there were approximately twice as many children receiving low-income child care subsidies in 2019 as in 1986 (176,738 compared to approximately 82,000)
Funding for operatorsPositiveDirect operational funding to licensed/regulated child care services — to lower fees, to raise wages, to improve quality — was in 2019 a very substantial proportion of all funding. It was nearly 100% of Quebec’s funding, and 50% on average in other provinces and territories.
Child care expenses deductionPositiveThe Child Care Expenses Deduction allows earners to deduct work-related child care expenses from income before taxes are assessed. In 1986, the claimable limit was $2,000 per child. Now, limits are $8,000 annually for children 0 to 6 and $5,000 annually for children 7 to 15 years.
Maternity and parental benefitsPositiveParental benefits have changed very dramatically since 1986. There were no legislated parental benefits at that time, only 15 weeks of maternity benefits under Unemployment Insurance. Now, Quebec and the rest of Canada have different maternity and parental benefit schemes, offering different levels of income replacement and different amounts of benefits reserved for the non-birthing parent. The total length of benefits — maternity, parental, paternity — can exceed a year, and can now include self-employed parents.
Child care educator wagesMixedChild care staff were poorly paid in 1986 and they are still poorly paid. Data on child care workers’ compensation are sketchy, but the evidence suggests that child care wages have improved and that wage enhancement grants in various provinces and territories have had some effect. But the picture is uneven. In some of Canada’s largest provinces, where the bulk of child care educators are located, and compared with the average hourly earnings of other workers, the movement in wages over time has been small.
Federal child benefitsPositiveFederal child benefits are, without doubt, larger than they were in 1986. These benefits provide between $5,000 and $7,000 per child (depending on age) to families with low incomes and some amount of child benefits to nearly all families. These benefits have had an impact on child poverty and are a very significant boost to income for families with very low incomes.

My Recent Presentation on Child Care Affordability

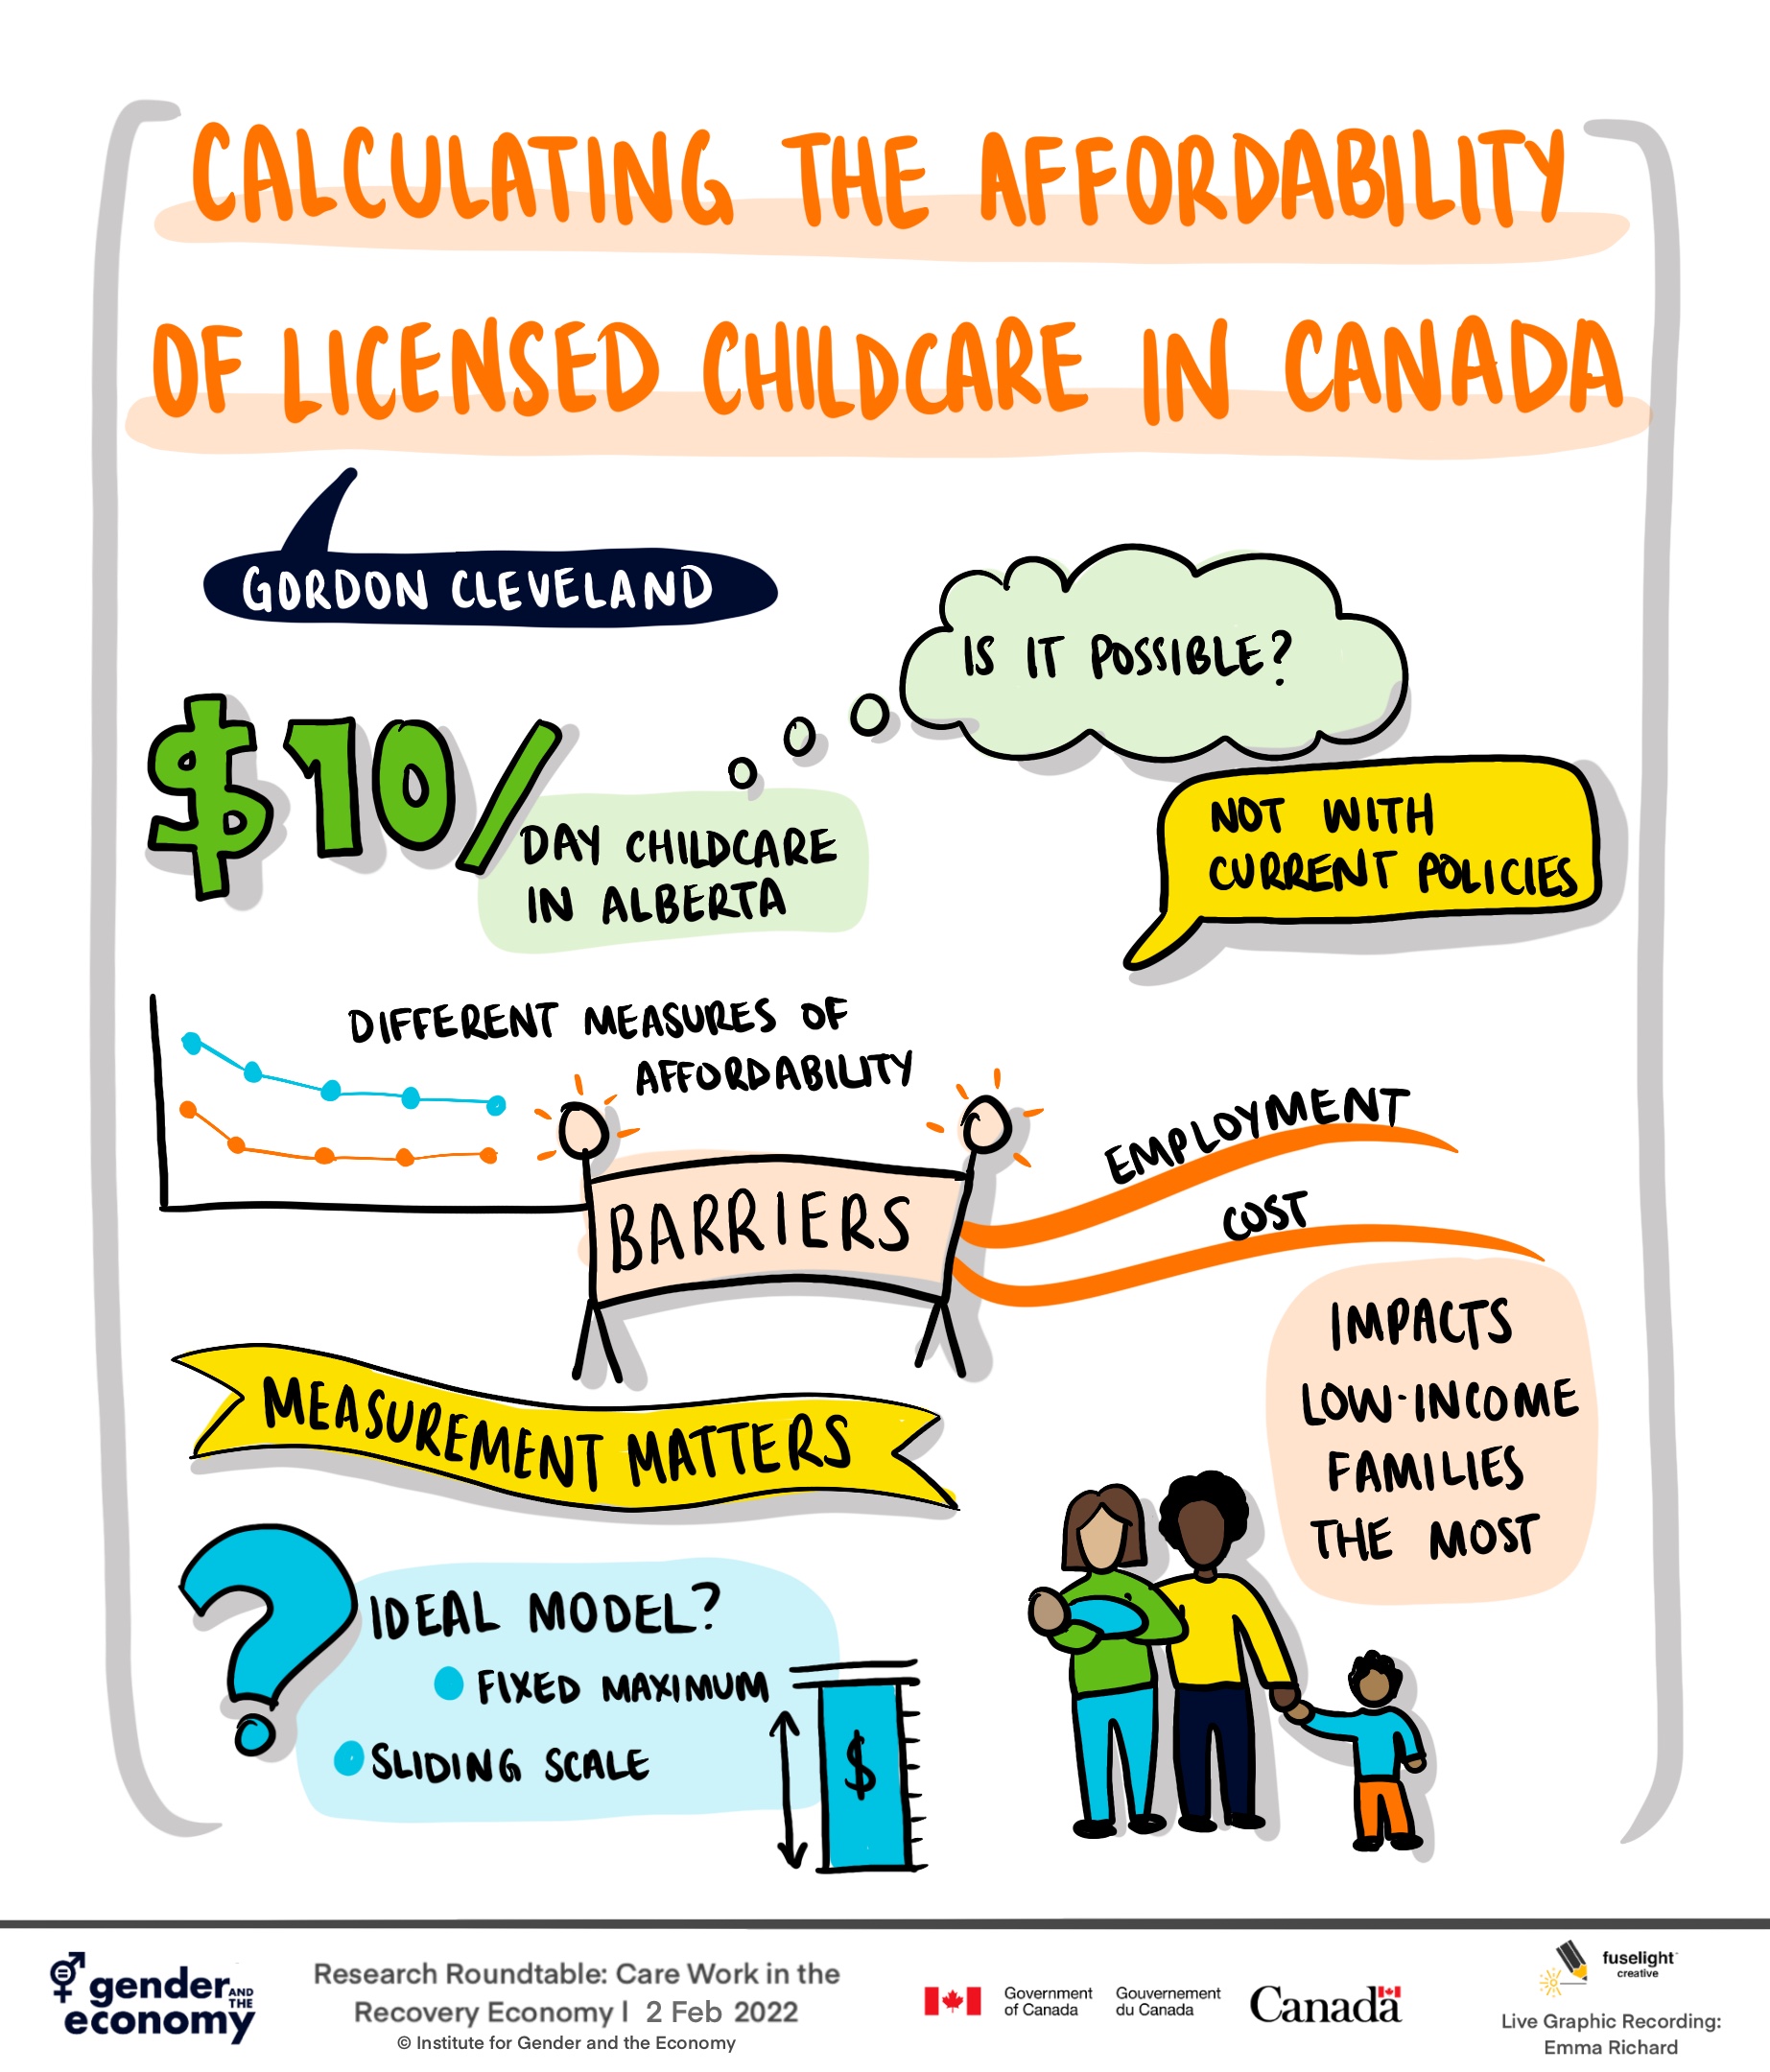
The Institute for Gender and the Economy recently sponsored a workshop on Care Work in the Recovery Economy. I did a short presentation with slides looking at Alberta’s new child care policies – following on the funding agreement with the federal government. Do the new policies get us to $10 a day? Are low-income families still disadvantaged with the burden of child care costs? I thought you might like to see the slides and draw conclusions.

And how about this neat graphic provided to me after the workshop by the workshop organizers!! It summarizes some of my main themes.

$10 a Day Child Care Will Dramatically Reduce Employment Barriers for Parents

A major new study (https://childcarepolicy.net/wp-content/uploads/2021/12/Ten_a_day-paper-web.pdf ) addresses the question of whether the $10 a day program will truly improve child care affordability and reduce barriers to employment for families.  It was written by economists Gordon Cleveland and Michael Krashinsky from the Department of Management at University of Toronto Scarborough.

Their study focuses on the situation facing couple families with one infant child and one preschooler in each of the three provinces at different possible levels of income.  The authors’ main conclusion is that the $10 a day program can and should dramatically change child care affordability and make employment a worthwhile option for many caregiving parents.  However, even if provinces and territories adopt a flat fee of $10 a day, they will need to have some kind of sliding scale to ensure that low-income families are not disadvantaged.

On the basis of this work, Dr. Gordon Cleveland says

  • “Ontario should sign a funding deal soon with the federal government; if they don’t reach an agreement by early next year, Ontario will lose about $1 Billion in child care funding.”  
  • “Our work shows that child care costs are a very large barrier to employment for many two-parent families, and that $10 a day child care will dramatically reduce those barriers.” 
  • “To reach an agreement, Ontario needs to develop a child care Action Plan.  That plan needs to include support for dramatic expansion of non-profit child care – at least 150,000 spaces over 5 years.   It needs a plan to phase-in more affordable child care, so that supply and demand increase together.  And it needs plans to pay early childhood educators more so we can recruit more trained staff now.”

Finance Minister Chrystia Freeland’s April Budget is spending $30 Billion over 5 years to make child care affordable enough to eliminate this major barrier to the employment of mothers of young children across Canada. As of December 2021, nine provinces and territories have signed on to the $10 a day early learning and child care program, with Ontario being a notable holdout.  This timely study seeks to determine whether the $10 a day policy gamble is likely to work, and what kind of funding reforms will make the effects more equitable.

Specific conclusions of the study include:

  • Under current policies, if a couple family with two children cannot access subsidies in Ontario (and most cannot) licensed child care at any income level is remarkably unaffordable. 
  • If Ontario offered licensed child care at a flat fee of $10 a day per child along with the existing tax credit, a couple family with two children would pay less than 15% of the caregiving parent’s income contribution in child care fees, no matter what their income level.  The child care cost barrier to employment would be dramatically reduced.
  • Alberta’s new funding policies agreed to with the federal government will improve affordability, particularly for families at higher levels of income.  Alberta plans to offer substantial operating grants to child care centres and homes to allow them to lower parent fees.  And Alberta is extending its subsidy system to cover families with partial subsidies out to $180,000 of family income.
  • The combination of grants and subsidies will still leave Calgary couple families with two children giving up more than 30% of net extra employment income if the caregiving parent earns less than $44,000 (family income of $110,000).   In other words, child care will be unaffordable for these families even when Alberta’s new child care policies are fully implemented. 
  • Edmonton families will be better off than Calgary families because median fees start off at a lower level before the new funding programs.  Only families where the caregiving parent earns less than about $18,000 (family income of $45,000) will find child care unaffordable (30% or more of the net income contribution of the second earner).
  • Manitoba pioneered flat fees for child care, and operational funding to lower fees.  However, its positive reputation is not supported by measures of current child care affordability. 
  • A flat fee of $10 a day per child (with no subsidy system) would improve affordability for nearly all couple families with two children in Manitoba except when the caregiving parent’s income is $14,000 or below.    However, a flat fee will mean that affordability is always worse for families the lower their income. 

Lies, Damned Lies, and Conservative Politicians

What a lot of whoppers!  If Erin O’Toole were Pinocchio, his nose would be 10 feet long by now.  Erin O’Toole, leader of the Conservative Party of Canada, has now come out with a full platform of policies, including policies on early learning and child care.  In it, he promises  (1) “to provide increased support for working families by providing increased funding for child care” (2) that “nobody should be prevented from getting back to work because they can’t afford child care” (3) that the Conservative policy will be “covering up to 75% of the cost of child care for lower income families” and (4) that “this will massively increase the support that lower income families receive and provide more assistance to almost all families”.  All of these promises are on page 47 of “Canada’s Recovery Plan” published by the Conservative Party of Canada. 

I live in Ontario, so I am going to look at this from an Ontario perspective.   Ontario ALREADY HAS a refundable tax credit for child care.  It already pays some money back to you in compensation for child care expenditures that are related to parental work or study.  The O’Toole policy is a bit more generous, especially for higher-income families, but has the same eligibility rules.  Since you can’t get paid twice for the same expenditures, the best the federal program can do is to REPLACE THE ALREADY EXISTING PROVINCIAL TAX CREDIT. At the same time, O’Toole is going to get rid of the federal Child Care Expense Deduction.

What does this mean for families in Ontario?  If you currently earn $30,000, your new tax credit will give you $640 more than the old one, but you will lose up to $1,200 of Child Care Expense Deduction.  You will be worse off.

If you currently earn $120,000, your new tax credit will give you $3,360 more than the old one, but you will lose up to $2,080 of Child Care Expense Deduction.  You will be better off to the tune of $1,280 per child per year.  Many other families’ situations will lie between these two examples.

Conclusions?

In Ontario, low income families will be worse off with the O’Toole plan.  Higher income families will be better off, but only by a couple of thousand dollars.   The chief beneficiary will be the Doug Ford government that will save about $400 million per year when it’s current child care tax credit program is superseded.

Should we be surprised?  The median cost of licensed child care in Ontario in 2020 was just over $17,000 for infants, just over $14,000 for toddlers, and just over $12,000 for preschoolers (2½ – 5 years).   For most families that can’t afford these fees now, a tax credit that gives you a couple of thousand dollars at best and limits the maximum subsidizable fee to $8,000 probably won’t change things much.

Should we be surprised?  Since we already have a refundable child care tax credit in Ontario and we have had it since 2019, we know whether this program will solve the child care affordability problem.  It doesn’t. 

Should we be surprised?  The Financial Accountability Office of Ontario analyzed what the effects of the Doug Ford tax credit would be back in 2019.  They concluded that: “Families that receive the CARE tax credit will receive an average benefit of approximately $1,300.”  Not $6,000 or $4,000, but $1,300.  They knew this program would not do much.  And the Financial Accountability Office also knew that low-income families were NOT going to benefit much.  As they concluded: “fewer than 300 families, or 0.1 per cent of all CARE tax credit recipients, will receive the maximum benefit entitlement per child” (p.3).  In other words, fewer than 300 families across Ontario would receive back 75% of their child care expenses.

Should we be surprised?  We know the approximate cost of the Erin O’Toole tax credit.  A very similar proposal was analyzed in 2017 by the C.D. Howe Institute.  The net cost was $1.2 Billion per year.  The ongoing amount of federal spending announced in the recent federal budget was $9.2 Billion per year.  Does Erin O’Toole really think that a program that is less than 1/7th the size of the proposed federal program will have a bigger impact on child care affordability?  I don’t think so.

Should we be surprised?  Reducing the child care affordability barrier to women’s full participation in employment is a big problem, not a small problem.  In a 2018 report to the Government of Ontario, I calculated that in 45% of Ontario families, the cost of licensed child care would eat up over 60% of the mother’s earnings contribution to household income.  For another 33% of families, the costs would eat up between 30% and 60% of the mother’s earnings contribution.  The Ford tax credit for child care expenses has not changed this situation by much, and neither would the O’Toole tax credit.  It will cost a lot of money to change this major employment barrier and O’Toole is not willing to spend it. 

How much will Doug Ford’s tax credit for child care cost?

Doug Ford’s promised in the last election to deliver child care affordability for a small amount of money ($389 million per year) for all children in Ontario 0-14 years of age. That’s a total of 2.2 million children. In other words, Doug Ford thinks he can make child care affordable for a price of less than $180.00 per child per year. On the face of it, this cannot possibly be true.

Continue reading “How much will Doug Ford’s tax credit for child care cost?”